There are some packages to plot gene structures, for example ggbio, ggtranscript... But there are still some limitations for them. The IGV software provides a good visualization for gene multiple isoforms. If you want to plot protein-coding or non-coding genes, it seems a little bit difficult for you to draw with a lot of codes. Here I developed a small R package named transPlotR which make gene structure visualization much easier. You can provide a little parameters to trancriptVis to make a plot with your own GTF files.
You can install the development version of transPlotR like so:
# install.packages("devtools")
devtools::install_github("junjunlab/transPlotR")This is a basic example:
library(transPlotR)
## basic example code
data(gtf)
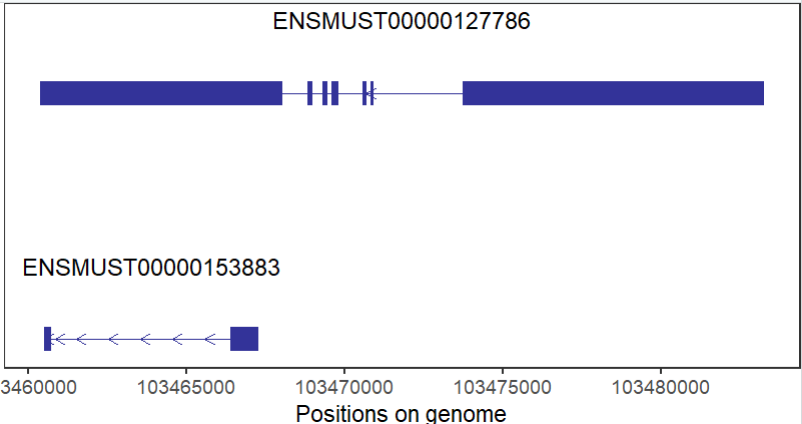
# non-coding gene
trancriptVis(gtfFile = gtf,
gene = 'Xist')