Using the daily trading data from the last five years a Markowitz portfolio optimization is made for six assets. The six stocks are Apple, Coke, Home Depot, Qualcomm, Tesla and Walmart. The Markowitz model of portfolio optimization is to find the maximum return while minimizing the risk of a given portfolio. The parameters that are found to accomplish the objectives are the percentages of the investment to invest in each available asset.
https://en.wikipedia.org/wiki/Modern_portfolio_theory
The parameters are chosen out of a 60000 by 6 random matrix. For each example portfolio allocation the rate of return and the average expected return are calculated. The rate of return is calculated from the difference between a time period's closing price and the closing price of the period before. The expected return for each asset is then calculated over all time periods.

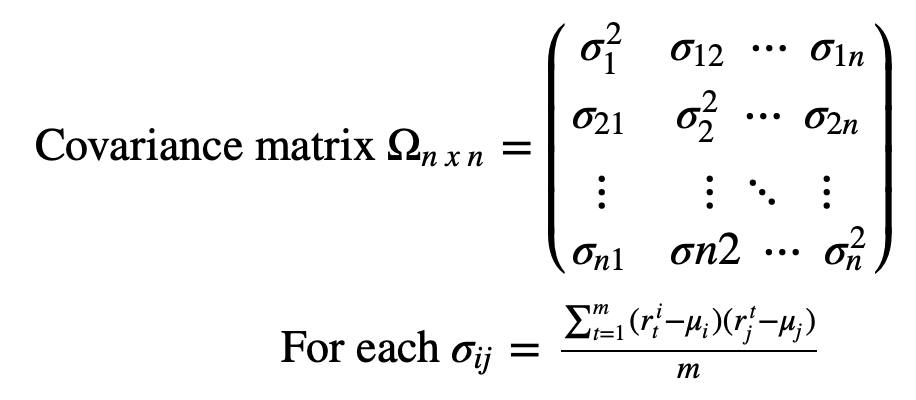
The covariance of each asset in accordance with all other assets including itself is then calculated and collected in a square symmetrical matrix.
Lastly the objective is to maximize the return of the portfolio while minimizing its risk. The constraint is that all funds must be split among all assets with no negative amounts or shorts. The amount invested must not exceed the amount on hand.

An optimal value can be chosen but normally there is a trade off when dealing with multiple objectives. A Pareto front is a selection of objectives that are non-dominant over all of other solutions. Having solutions that are non-dominant allows for a trade-off between what is desired. Since our goal is to have a maximum return with minimum risk or variance, each portfolio in our non-dominated list will have a trade-off between objectives. No one portfolio is strictly better than the next portfolio in both objectives. For this purpose, if a higher return is desired then the risk would also increase. If a lower risk is desired, then a lower return would be the result. Moving from one solution in our Pareto frontier to the next would have to result in this tradeoff. The graphs of the data and the pareto curve are as follows:


An investor will be comfortable with a certain amount of risk. We can see that the maximum return on our Pareto frontier is about .18 percent daily or 200% over 5 years. This could be more, and it could be less. The daily risk for the same return is 2.6% each day. This is the dispersion or variance around the expected return of the portfolio. The return of the portfolio can be off of the expected return each day by 2.6%. This amount of risk might be too much for some investors because if the
dispersion is in a negative direction each day then the portfolio could instead lose 200% of its value over the 5-year time period, which is impossible because the portfolio could eventually be worthless and not negative in value. A way to measure the Return to Risk ratio is by calculating the Sharpe ratio for the portfolio. The Sharpe ratio is ratio between the difference of the average return of the portfolio and a risk free asset and the standard deviations of returns for the same time period:

The Sharpe ratio for the highest of the Pareto-optimal returns is about .09 or 9%. This could be an indicator that the selected assets are not the optimal ones for the portfolio. Some diversification such as a greater allocation of funds in risk-free assets such as an ETF or government bonds could help to lower the volatility and improve the Sharpe ratio.