Using Search Console and Google Analytics data for SEO
Using Search Console and Google Analytics together can give you a more comprehensive picture of how your audience discovers and experiences your website, which can help you make more informed decisions as you work on your site's SEO. This guide explains how to use Looker Studio to monitor metrics from Search Console and Google Analytics, visualize the data together, and troubleshoot data discrepancies between the tools.
About Google Analytics and Search Console
Using both of these tools together can help you understand your audience better, and how they experience your website (before and after they land on your site). It can give you a quick idea of how your site is performing on Google Search and how it relates to other traffic sources.
- Search Console: Provides data about how your website is performing in Google Search results, such as how many times your website shows up in search results (impressions), how many times people click to visit your site from Search (clicks), which search terms bring people to your website (queries), and more. It focuses on activity that happened before a person arrived at your website from Google Search.
- Google Analytics: Provides data about visitors' interactions with your website, such as which pages they visit, how long they stay, and what actions they take. It also shows you data about where your audience is coming from, which can help you measure the effectiveness of your traffic channels, like email, referrals from other websites or social platforms, paid search, and organic search.
Comparing data in Google Analytics and Search Console
Comparing Search Console performance data with Google Analytics organic traffic can be particularly helpful when attributing conversions (such as ecommerce transactions, newsletter signups, lead generation form fill) to Google Search traffic. However, these tools use different metrics and systems, which means the data won't match completely and you'll have access to more metrics when you visit each tool.
To get an idea of the general pattern of your data, we recommend focusing on these two metrics, as they're the most comparable:
|
Search Console Clicks A click happens when a person clicks on a link in a Google Search result leading to your website. |
Google Analytics Sessions A session is a period of time during which a user interacts with your website or app. |
Monitor your Google organic search traffic in Looker Studio
Using Looker Studio, you can visualize your site's organic search traffic from both Search Console and Google Analytics in one view. To start monitoring with your own data, you can use our Looker Studio dashboard template.
Set up the dashboard
When you first open the dashboard template, you'll see several errors. This happens because you need to configure your own data before you can see the charts:
- Open the dashboard template.
- Click Use my own data.
- Configure your data sources:
- Connect to Search Console and choose URL Impression in the Tables panel.
- Connect to Google Analytics.
- Continue connecting each chart to its relevant data source.
Understanding the dashboard
The dashboard shows you Google Analytics and Search Console data side by side. To help you recognize each data source, the dashboard uses orange for Google Analytics and blue for Search Console in all charts.
Filters and data controls
To better focus on Google organic Search traffic, the Google Analytics data is already filtered to
include only sessions from Session source = google and Session medium = organic.
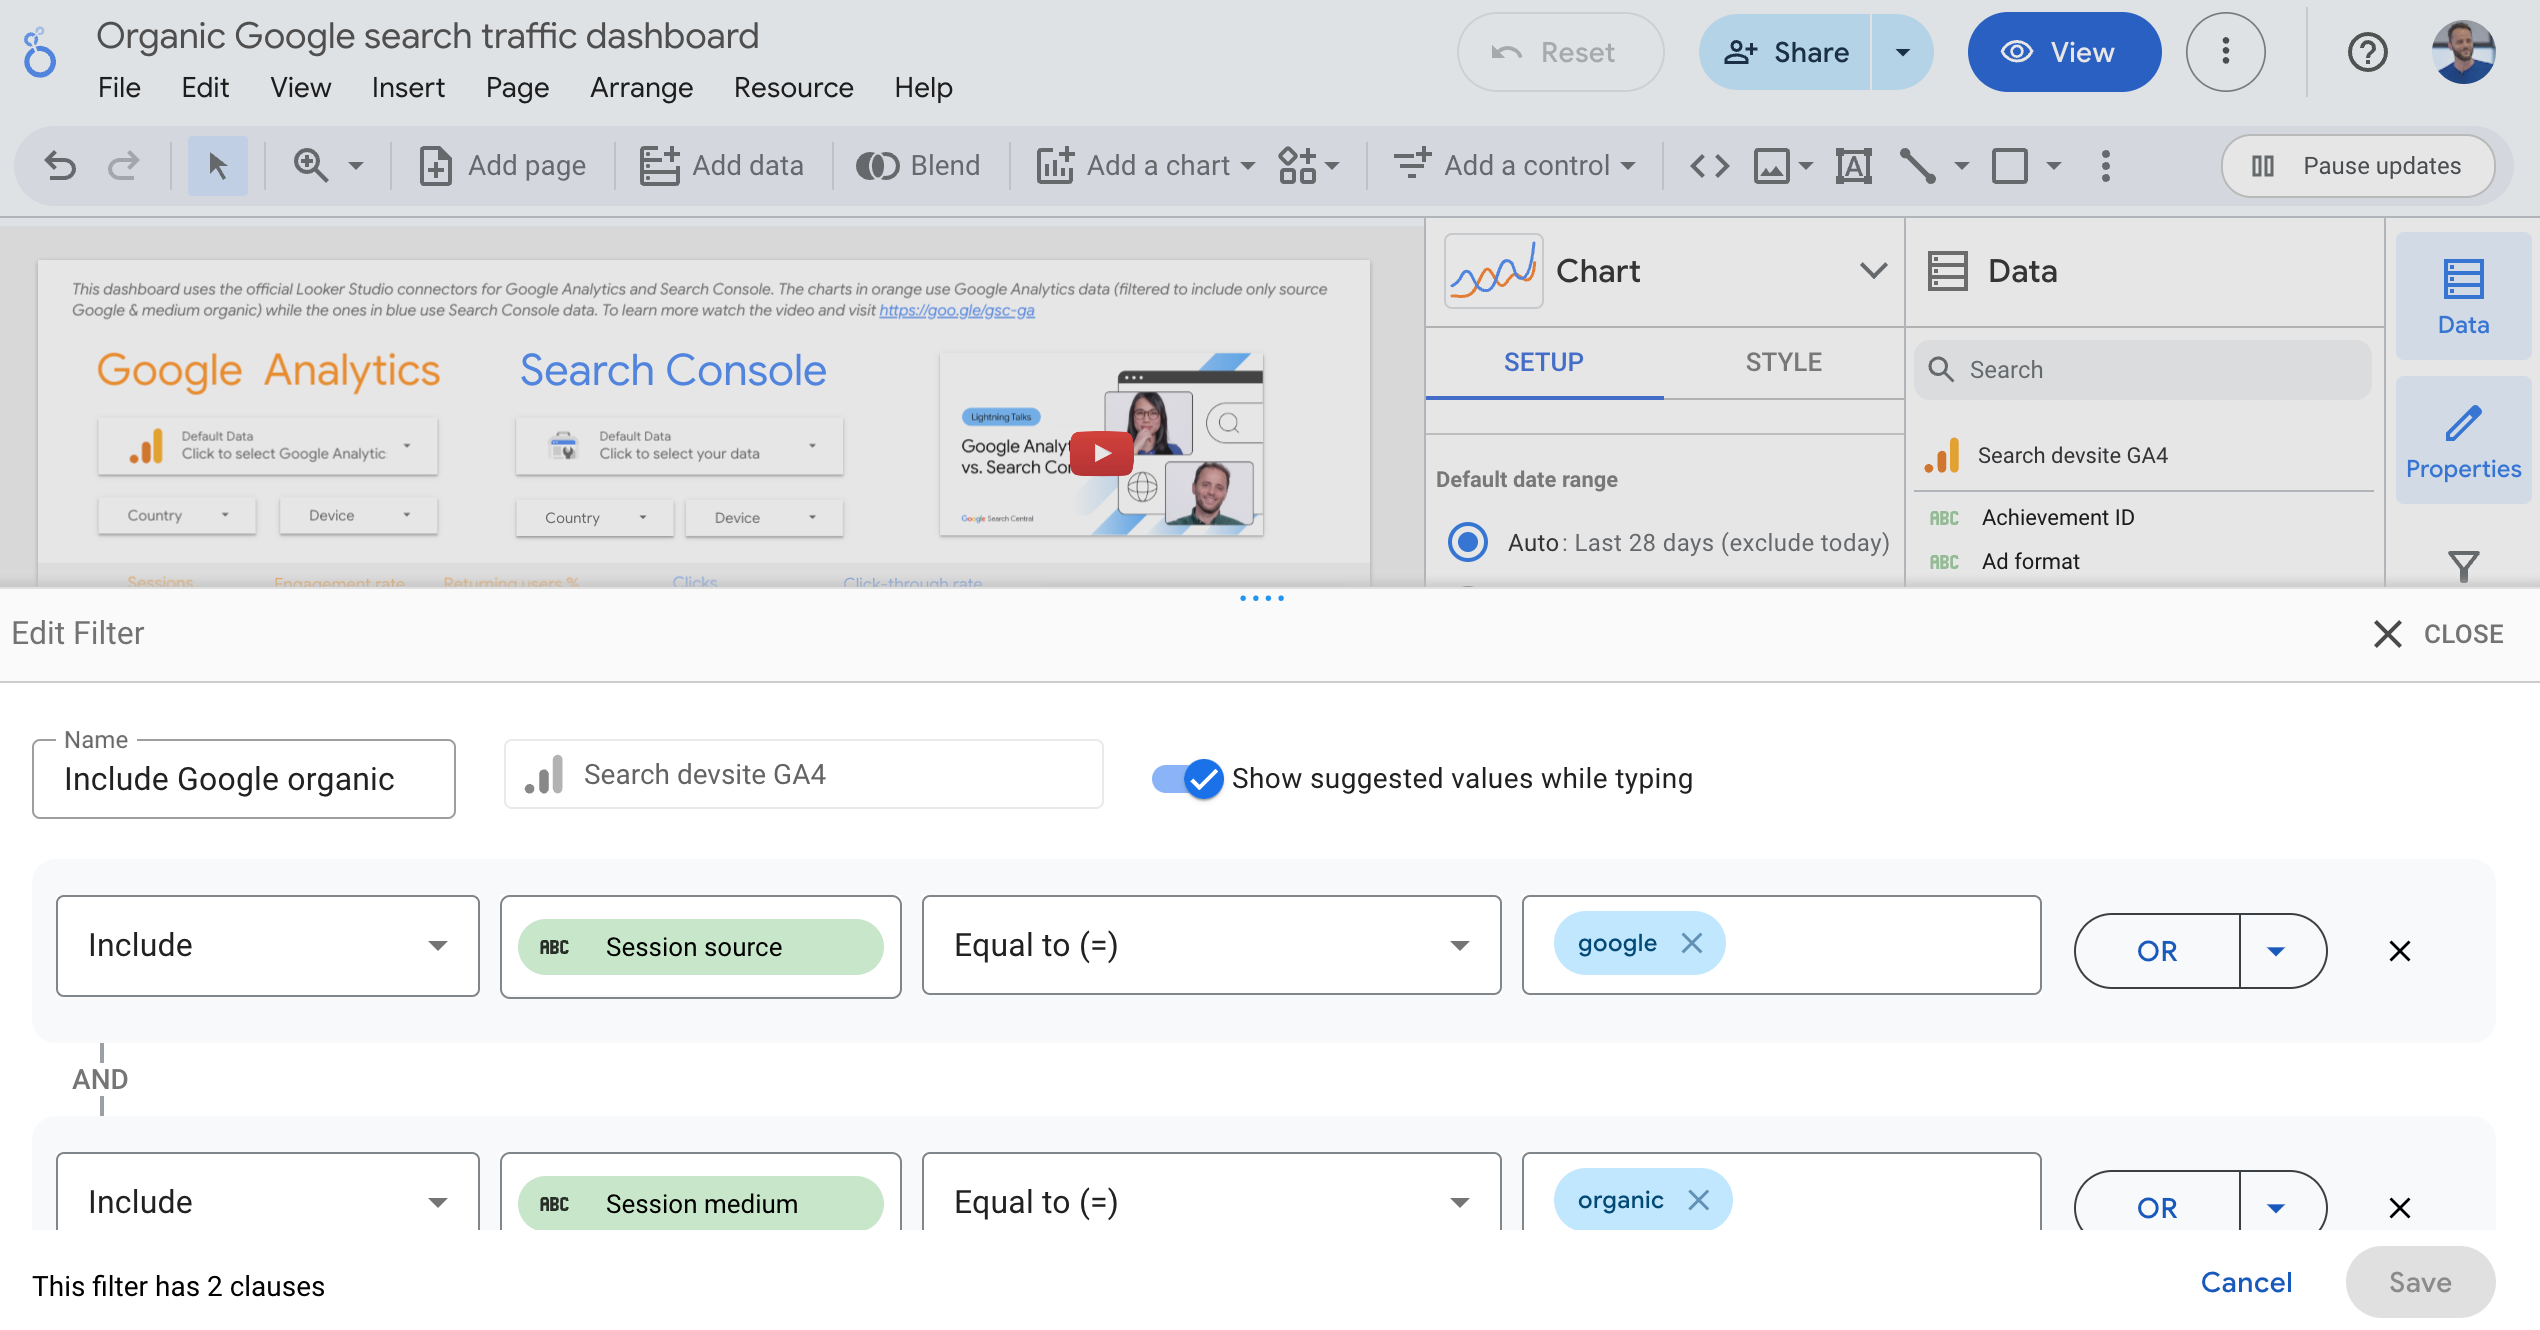
The dashboard includes the following filters and data controls to help you control your data effectively:
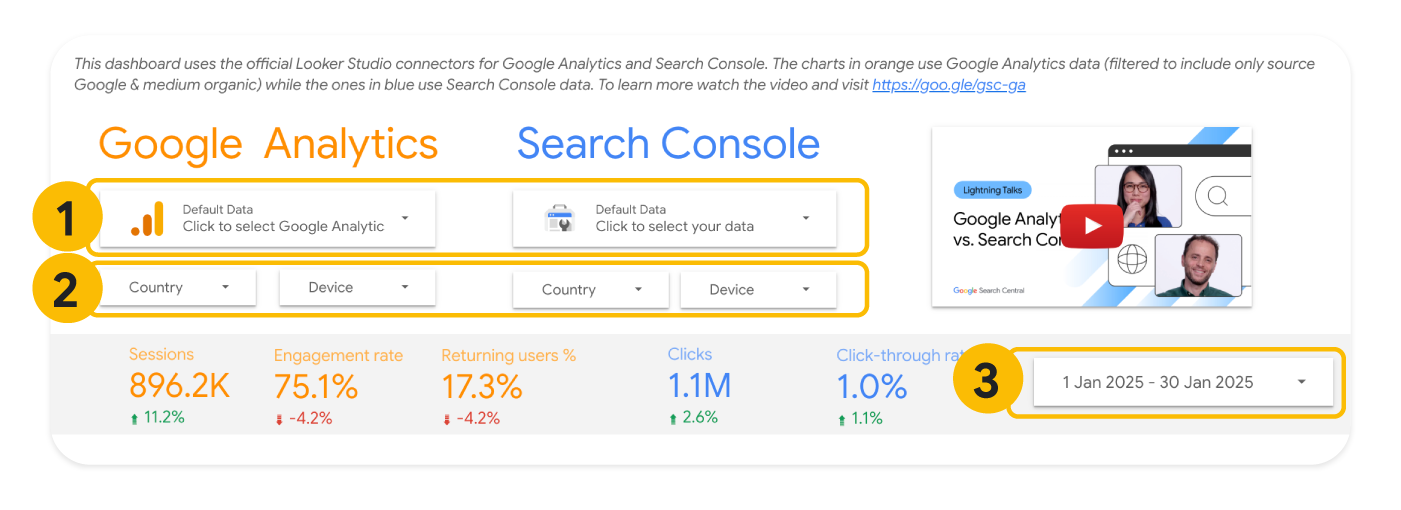
- Data controls: Choose the Search Console and Google Analytics property you'd like to analyze. Toggling between properties can be particularly useful if you have access to multiple accounts and want to switch between them.
- Country and device: Include or exclude countries and device categories.
- Date range: Choose the date range you'd like to see in the dashboard. The default time range of the report is "last 28 days", but Search Console data can be delayed by a couple of days. You can always change the time range to suit your needs.
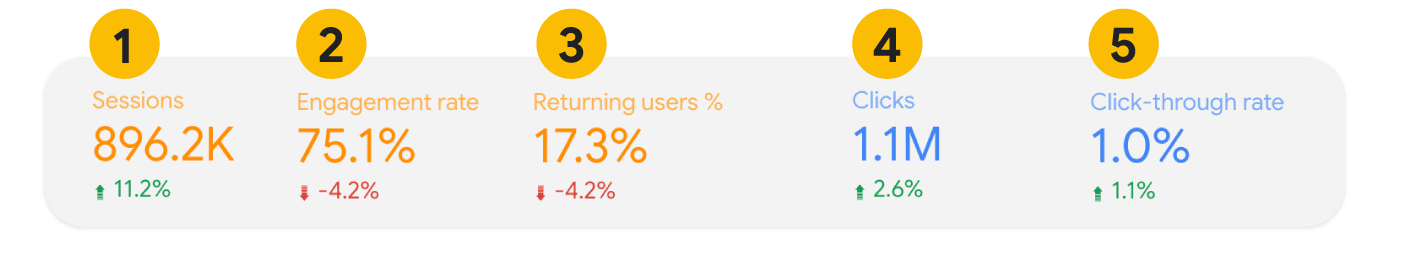
Metrics
The dashboard uses five metrics, which provide an overall picture of the volume and quality of your website's organic search traffic:
| Metrics in the dashboard | |
|---|---|
| 1. Sessions
(Google Analytics) |
A period of time during which a user interacts with your website. In the context of a website, a session starts when a user views a page or screen on your website and no session is active (for example, their previous session has timed out). This shows the volume of traffic on your website that is attributed to organic search. Learn more about how sessions are counted. |
| 2. Engagement rate
(Google Analytics) |
The percentage of sessions that engage with your content. An engaged session is one that meets any of the following criteria:
Learn more about engagement rate. |
| 3. Returning users
(Google Analytics) |
The percentage of users who have initiated at least one previous session and came back to your website. This shows whether people come back to your website through organic Search. Learn more about returning users. |
| 4. Clicks
(Search Console) |
The total number of clicks from Google Search results leading the user to your website. Learn more about how clicks are counted. |
| 5. Click-through rate (CTR)
(Search Console) |
The click count divided by the impression count. This shows how often users who see your website on Google Search results click a link to visit it. |
Charts
The dashboard also includes several charts, which can help you better analyze how your audience is visiting your site when coming from Google organic search. Remember that orange is for Google Analytics data, and blue is for Search Console data.
These charts focus on patterns that can help you understand when something happens. The dashboard goal is not to dive deep into the data; it's for quickly spotting changes in traffic.
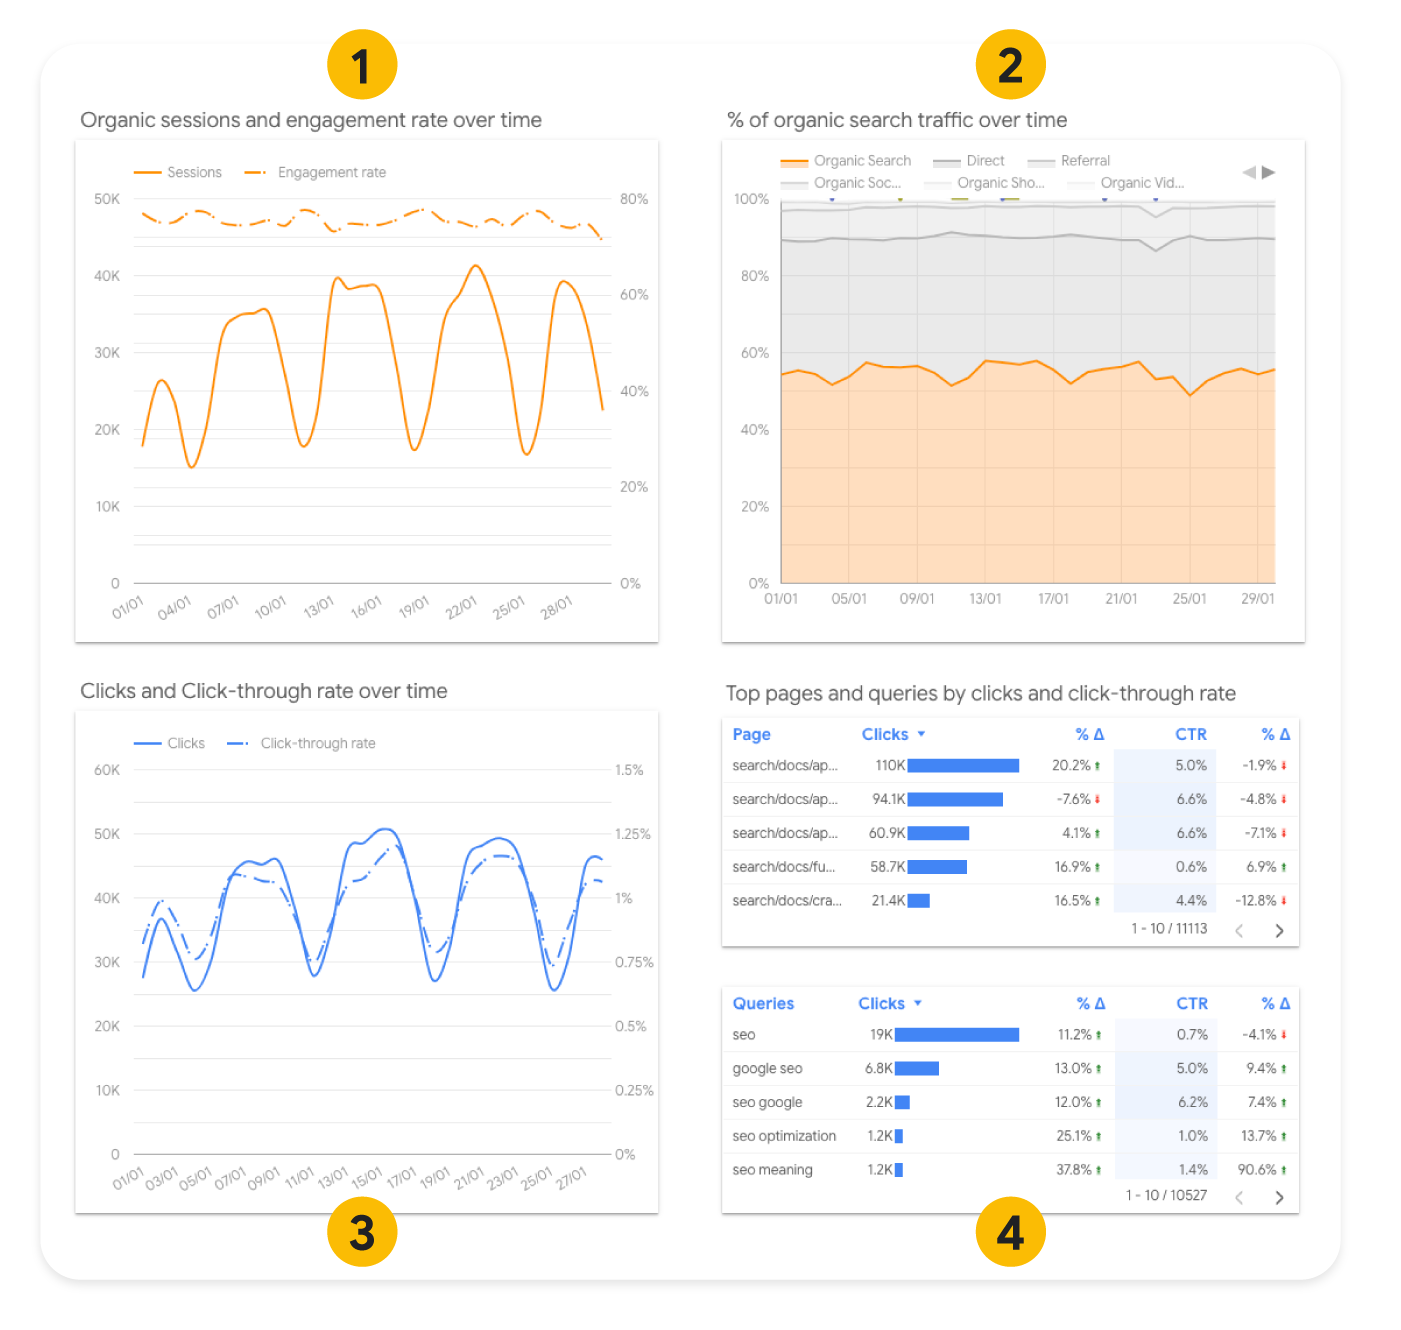
- Organic sessions and engagement rate over time: Sessions show the volume of
traffic you're getting from Search, and engagement rate shows the quality of the traffic; having
both together is a good way to assess if your organic search traffic is doing well.
- If you see a big change in your organic traffic, go to Search Console to analyze further, we have documentation explaining what to do if you see a drop in traffic.
- If you see a drop in engagement rates, analyze your content and try to understand if you can make it more relevant to your organic search audience (for example by making sure that the page content is closely related to the queries your audience is using to find you).
- Percentage of organic search traffic over time: There's no good or bad percentage, as this depends on your audience and your business. If the trend changes significantly, and the sessions and engagement chart did not, go to Google Analytics and review your Traffic acquisition report. Maybe some other traffic source is increasing or decreasing significantly, which could drive the organic search percentage up or down.
- Clicks and CTR over time: Clicks and CTR show volume and quality of your performance on Google Search: they show if people click your site in search results and if your search snippets are successful in persuading people to click through. If you see a change in your usual pattern, check which specific queries and pages experienced a drop or a spike.
- Top pages and queries by click and CTR: The specific pages and queries that are receiving the highest number of clicks. This and the country tables also include columns showing how much the metrics available changed from the previous period that was selected in the date range picker.
- Top countries tables: If your site serves multiple countries or regions, it might be worth looking deeper into those stats. You can do that both in Google Analytics (using a report filter) or in Search Console (using a performance filter); after you filter your data to include only a specific country, you can look for changes in pages or queries over time.
Investigate more deeply in Google Analytics and Search Console
The source of truth for Search performance will always be Search Console, while the source of truth for behavior inside your site will be Google Analytics. The organic Google Search traffic dashboard can help you monitor your search traffic, but not necessarily to debug and find solutions for issues with your traffic (for that, you can access each tool directly).
In Google Analytics, the following reports are particularly useful for diving deeper and investigating your site's organic search performance:
- Traffic acquisition report: Investigate the session sources. Here you can see how many sessions originated from the channel "Organic Search" and the source "Google". You can use this to understand more about your Google Search traffic, for example, which actions people took on your website, and if eventually they made a purchase or subscribed to your content.
- Landing page report with a filter to include only sessions from google organic: This gives you an idea of how useful the page is to your organic traffic, and also how well the page does in terms of driving engagement and conversions on your website.
In Search Console, the Performance reports are the most useful for understanding traffic fluctuations. Start by reviewing the Performance report common tasks to understand the data, and if necessary, try other reports available in the tool.
Understanding data discrepancies between Google Analytics and Search Console
When comparing the data between these tools, you will notice that even the most similar metrics—sessions and clicks—don't match exactly. Although the total counts don't match exactly, what's important is that the general trends have the same pattern. This section explains why there may be differences, and how to minimize larger discrepancies (if applicable).
- Small discrepancy: If the difference is small, you can ignore the discrepancies. Since the systems are different, it's normal and expected that the numbers will be a little different, and it's not something you need to fix.
- Big discrepancy: If the difference is considerable, look further into the following reasons. You may be able to minimize the difference, or at least pinpoint the reason why the numbers vary.
Main reasons for a big discrepancy in clicks and sessions
When looking at the organic Google Search traffic dashboard, or when comparing sessions to clicks data exported from the tools, you might notice that you have a difference between Google Analytics and Search Console data. If you find a discrepancy in the data, check if any of the following scenarios apply to your site. There might be more than one reason depending on your site configurations, audience, and traffic composition.
| Reasons for a big discrepancy in clicks and sessions | |
|---|---|
| Implementation in Google Analytics |
Google Analytics is a tool that lets you collect behavioral data by implementing a tag on your website or app — so it depends on what and how you implement it. In Google Analytics, there are implementation and configuration issues that can affect your data quality. For example, there could be pages on your website where the Analytics tag is missing. To make sure your Analytics is set up properly, follow the steps in the set up guide. On the other hand, Search Console is a tool that gives you access to Google Search data, which is processed by Google for all properties uniformly. This means that the way you configure your settings will have less impact on the data. |
| Cookies or tracking |
If your site is asking users to accept tracking, and users opt out, that can skew Google Analytics data. Read this introduction to user consent management to learn more about how to handle this from an Analytics perspective. |
| Timezone |
You can choose your timezone in Google Analytics, but you can't customize that in Search Console, where the default time zone is PST. This is particularly noticeable if you set your timezone in Google Analytics to a location that has a big offset from PST (for example, if your site primarily serves users in Australia). |
| Attribution |
There are three attribution models available to you in Google Analytics, while Search Console counts every click in Google Search. The closest attribution model available is the default model in Google Analytics. |
| Canonical URLs |
Search Console reports only on the Google Search canonical URL, whereas Google Analytics reports on any URL that includes the tracking code. That means that you'll likely see higher numbers of URLs in Google Analytics. |
| Traffic breakdowns |
Search Console breaks down the traffic by web, image, video, news and Discover. These category breakdowns are different in Google Analytics. |
| Non-HTML pages |
If your site has non-HTML pages (for example, PDFs), Search Console includes these pages by default if they're shown or clicked in Search. Your Google Analytics may not be configured to measure them — a good place to start is turning on the enhanced measurement events. |
| Bot traffic |
Google Analytics automatically excludes traffic from known bots and spiders automatically, while Search Console doesn't necessarily filter them out. |
Resources for using Search Console and Google Analytics together
If you'd like to learn about other ways to analyze and visualize Search Console and Google Analytics together, check out these resources:
- Connect Search Console to Google Analytics: This makes a few Search Console reports available within Google Analytics, which can be helpful if you're looking for a quick way to access the queries and landing pages that drove Google organic search traffic to your website.
- Site Kit plugin for WordPress: If your site is on WordPress, you can view both Google Analytics and Search Console data in a single dashboard within Wordpress.
- Search Console Bulk data export and Google Analytics export to BigQuery: To get the most details and minimize data discrepancies, we recommend exporting your Search Console data to BigQuery and merging it with data from the Google Analytics BigQuery export.