What-If Analysis with Data Tables in Excel
Last Updated :
16 Oct, 2022
What-if analysis is the option available in Data. In what-if analysis, by changing the input value in some cells you can see the effect on output. It tells about the relationship between input values and output values. In this article, we will learn how to use the what-if analysis with data tables effectively.
What is What-if Analysis?
What-if analysis is a procedure in excel in which we work in tabular form data. In the What-if analysis variety of values have been in the cell of the excel sheet to see the result in different ways by not creating different sheets. There are three tools of what-if analysis.
Tools of what-if analysis
There are three tools in what-if analysis:
- Goal seek
- Scenario manager
- Data Table
Goal seek
In goal seek we already know our output value we have to find the correct input value. For example, if a student wants to know his English marks and he knows all the rest of the marks and total marks in all subjects.
Step 1: Write all subjects and their marks in an excel sheet and do the sum by applying the formula sum.

Step 2: Go into the data tab of the Toolbar.

Step 3: Under the Data Table section, Select the What-if analysis.

Step 4: A drop-down appears. Select the Goal Seek.

Step 5: The dialogue box appears in the first column write the name of the cell in which you apply the formula sum. Type D10 in Set cell.

Step 6: In the second column write the value of the target. The target value for this example is 440.

Step 7: In the third column write the name of the cell in which you want to get marks in English. Provide absolute cell reference, i.e. $D$5.

Step 8: Click ok and see the result. The estimated marks for English are 71.

Scenario Manager
In scenario manager, we create different scenarios by proving different input values for the same variable than by comparing scenarios to choose the correct result. For Example, To check the cost of revenue for three different months.
Step 1: Given a data set, for Revenue Cost of Jan, with Expenses and Cost as its columns.

Step 2: Select the numerical value cell and Go to the Data.

Step 3: Under the forecast section, click on the What-if analysis.

Step 4: A drop-down appears. Select the Scenario manager.

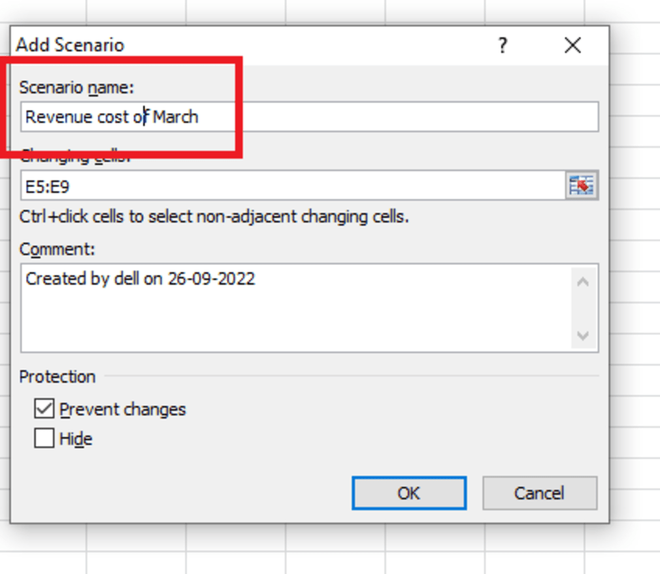
Step 5: A dialog box appears in the dialog box select add option.

Step 6: A new dialog appears to write the name of the new scenario in the first column. Under Scenario name, write "Revenue of Feb".

Step 7: In the second column select the changing cell. The changing cells for this example, are $E$5:$E$9.

Step 8: A new dialogue box name Scenario Values appears to write the changed value in the box. Enter the values as per shown in the image. Click Ok.

Step 9: Repeat step5, step6, and step8.


Step 10: Click Ok then select summary.

Step 11: A new Dialog box name Scenario Summary appears. Select Result cells: $E$10.

Step 12: See the result.
Data Table
In data, we create a table with different input values for the same variables. It is one of the most helpful features in what-if analysis. One can change different values in x and can achieve different outputs accordingly for research as well as business-driven purposes.
A data table is of two types:
Data table in one Variable
In the data table in one variable, we can change only one input value either in a row or in a column. It includes only one input cell. For example, a company wants to know about its revenue by changing the cost of raw materials by using a data table. Given a data set, with material and their cost.
Step 1: Create a table of revenue cost.

Step 2: Copy the last cell in which you get output in another cell. D7 for this example.

Step 3: Write the values in the cell for which you want to make a change in a column or in rows.

Step 4: Go to the data tab of the Toolbar.

Step 5: Under the data table section, Select the what-if analysis.

Step 6: A drop-down appears. Select the Data Table.

Step 7: A dialogue box name data table appears then select the cell in which you want to change the input value in a row or in the column. Input the value of the Column input cell to be $D$3. Click Ok. Your data table is ready.

Data table in two Variable
In the Data table in two variables, we can change two input values in both row and column. It includes two input cells. For example, A person wants to know about per month installments of loan by the different rates of interest and for the different time periods for the same principal amount.
Step 1: Create a table to find PMT.

Step 2: Copy the last cell in which you get output in another cell

Step 3: Write both values you want to change in both columns and rows.

Step 4: Go to the Data tab of the toolbar.

Step 5: Select the what-if analysis.

Step 6: Select the Data Table.

Step 7: A dialogue box appears in which you have to select the cell in which you want to change the value in both row and column. The Row input cell value is $D$5 and the column input cell value is $D$6.

Step 8: Click ok and see the result.

Similar Reads
How to Install Data Analysis Toolpak in Excel?
Analysis Toolpak is a kind of add-in Microsoft Excel that allows users to use data analysis tools for statistical and engineering analysis. The Analysis Toolpak consists of 19 functional tools that can be used to do statistical/engineering analysis. Given below is a table that includes names of all
3 min read
Top Excel Data Analysis Functions
Have you ever analyzed any data? What does it mean? Well, analyzing any kind of data means interpreting, collecting, transforming, cleaning, and visualizing data to discover valuable insights that drive smarter and more effective decisions related to business or anywhere you need it. So, Excel solve
6 min read
Instant Data Analysis in Advanced Excel
In order to execute complicated data analysis, reporting, and visualization tasks in Microsoft Excel, users must employ a collection of tools, functions, and features called "Advanced Excel." Pivot tables, lookup features, data validation, macros, and other features are among its features. Data anal
5 min read
Top Excel Interview Questions for Data Analysis
Excel helps data analysts change and look at data to find patterns. It arranges and shows facts so that decisions can be made. It does data cleaning, transformation, report and dashboard creation, and more. Preparing for popular Excel interview questions can help you get the job. Here, you can find
13 min read
Exploring Data with PivotTables in Excel
Broad information examination can be done utilizing PivotTables and produce wanted reports. The joining of the Data Model with PivotTable improves how the information is examined, associated, summed up, and detailed. You can import tables from outside information sources and make a PivotTable with t
4 min read
What is Statistical Analysis in Data Science?
Statistical analysis serves as a cornerstone in the field of data science, providing essential tools and techniques for understanding, interpreting, and making decisions based on data. In this article we are going to learn about the statistical analysis in data science and discuss few types of stati
6 min read
Single-Table Analysis with dplyr using R Language
The dplyr package is used to perform simulations in the data by performing manipulations and transformations. It can be installed into the working space using the following command : install.packages("dplyr") Let's create the main dataframe: R #installing the required libraries library(dplyr) #creat
5 min read
How to Create a Two-Variable Data Table in Excel?
Two-Variable Data Table is a very significant tool for what-if data analysis. With the help of two-variable data tables, we can find all possible trends that can arrive by changing different values. For example, if we know the annual sales of a company, its percentage of expenses and growth. So, by
2 min read
Excel Project for Data Analysis: The Six Steps Approach
Excel is a powerful tool that Data Analysts use to transform raw data into actionable insights, aiding decision-making and business success. Analysts play a detective-like role, identifying patterns and interpreting trends to convey complex data in a straightforward manner. In this tutorial, we will
9 min read
Analyzing Large Datasets With Power Pivot in Microsoft Excel
The setting for Power Pivot… If you are a successive Excel client, then you are most likely acquainted with turn tables. They are utilized for sorting out speedy bits of knowledge from modest quantities of information and can likewise be transformed into straightforward charts. In any case, even Exc
5 min read