Matplotlib.artist.Artist.properties() in Python
Last Updated :
10 May, 2020
Matplotlib is a library in Python and it is numerical – mathematical extension for NumPy library. The
Artist class contains Abstract base class for objects that render into a FigureCanvas. All visible elements in a figure are subclasses of Artist.
matplotlib.artist.Artist.properties() method
The
properties() method in artist module of matplotlib library is used to get the dictionary of all the properties of the artist.
Syntax: Artist.properties(self)
Parameters: This method does not accepts any parameters.
Returns: This method return dictionary of all the properties of the artist.
Below examples illustrate the matplotlib.artist.Artist.properties() function in matplotlib:
Example 1:
Python3 1==
# Implementation of matplotlib function
from matplotlib.artist import Artist
import numpy as np
import matplotlib.pyplot as plt


xx = np.random.rand(16, 30)

fig, ax = plt.subplots()

m = ax.pcolor(xx)
m.set_zorder(-20)

w = Artist.properties(ax)
print("Display all Properties\n")
for i in w:
    print(i, ":", w[i])

fig.suptitle('matplotlib.artist.Artist.properties() \
function Example', fontweight ="bold")

plt.show()

Display all Properties
adjustable : box
agg_filter : None
alpha : None
anchor : C
animated : False
aspect : auto
autoscale_on : True
autoscalex_on : True
autoscaley_on : True
axes_locator : None
axisbelow : line
children : [<matplotlib.collections.PolyCollection object at 0x0ABB8470>, <.spines.Spine object at 0x08221EF0>, <matplotlib.spines.Spine object at 0x08221F90>, <matplotlib.spines.Spine object at 0x08237050>, <matplotlib.spines.Spine object at 0x082370F0>, <matplotlib.axis.XAxis object at 0x08221E70>, <matplotlib.axis.YAxis object at 0x08237370>, Text(0.5, 1.0, ''), Text(0.0, 1.0, ''), Text(1.0, 1.0, ''), <matplotlib.patches.Rectangle object at 0x0824CD90>]
clip_box : None
clip_on : True
clip_path : None
contains : None
data_ratio : 0.5333333333333333
default_bbox_extra_artists : [<matplotlib.collections.PolyCollection object at 0x0ABB8470>, <matplotlib.spines.Spine object at 0x08221EF0>, <matplotlib.spines.Spine object at 0x08221F90>, <matplotlib.spines.Spine object at 0x08237050>, <matplotlib.spines.Spine object at 0x082370F0>, <matplotlib.axis.XAxis object at 0x08221E70>, <matplotlib.axis.YAxis object at 0x08237370>, Text(0.5, 1.0, ''), Text(0.0, 1.0, ''), Text(1.0, 1.0, ''), <matplotlib.patches.Rectangle object at 0x0824CD90>]
facecolor : (1.0, 1.0, 1.0, 1.0)
fc : (1.0, 1.0, 1.0, 1.0)
figure : Figure(640x480)
frame_on : True
geometry : (1, 1, 1)
gid : None
gridspec : GridSpec(1, 1)
images : <a list of 0 AxesImage objects>
in_layout : True
label :
legend : None
legend_handles_labels : ([], [])
lines : <a list of 0 Line2D objects>
navigate : True
navigate_mode : None
path_effects : []
picker : None
position : Bbox(x0=0.125, y0=0.10999999999999999, x1=0.9, y1=0.88)
rasterization_zorder : None
rasterized : None
renderer_cache : None
shared_x_axes :<matplotlib.cbook.Grouper object at 0x080ACD70>
shared_y_axes : <matplotlib.cbook.Grouper object at 0x080B8BB0>
sketch_params : None
snap : None
subplotspec : <matplotlib.gridspec.SubplotSpec object at 0x07428ED0>
title :
transform : IdentityTransform()
transformed_clip_path_and_affine : (None, None)
url : None
visible : True
window_extent : TransformedBbox(
Bbox(x0=0.125, y0=0.10999999999999999, x1=0.9, y1=0.88),
BboxTransformTo(
TransformedBbox(
Bbox(x0=0.0, y0=0.0, x1=6.4, y1=4.8),
Affine2D(
[[100. 0. 0.]
[ 0. 100. 0.]
[ 0. 0. 1.]]))))
xaxis : XAxis(80.0, 52.8)
xaxis_transform : BlendedGenericTransform(
CompositeGenericTransform(
TransformWrapper(
BlendedAffine2D(
IdentityTransform(),
IdentityTransform())),
CompositeGenericTransform(
BboxTransformFrom(
TransformedBbox(
Bbox(x0=0.0, y0=0.0, x1=30.0, y1=16.0),
TransformWrapper(
BlendedAffine2D(
IdentityTransform(),
IdentityTransform())))),
BboxTransformTo(
TransformedBbox(
Bbox(x0=0.125, y0=0.10999999999999999, x1=0.9, y1=0.88),
BboxTransformTo(
TransformedBbox(
Bbox(x0=0.0, y0=0.0, x1=6.4, y1=4.8),
Affine2D(
[[100. 0. 0.]
[ 0. 100. 0.]
[ 0. 0. 1.]]))))))),
BboxTransformTo(
TransformedBbox(
Bbox(x0=0.125, y0=0.10999999999999999, x1=0.9, y1=0.88),
BboxTransformTo(
TransformedBbox(
Bbox(x0=0.0, y0=0.0, x1=6.4, y1=4.8),
Affine2D(
[[100. 0. 0.]
[ 0. 100. 0.]
[ 0. 0. 1.]]))))))
xbound : (0.0, 30.0)
xgridlines : <a list of 7 Line2D gridline objects>
xlabel :
xlim : (0.0, 30.0)
xmajorticklabels : <a list of 7 Text major ticklabel objects>
xminorticklabels : <a list of 0 Text minor ticklabel objects>
xscale : linear
xticklabels : <a list of 7 Text major ticklabel objects>
xticklines : <a list of 14 Line2D ticklines objects>
xticks : [ 0. 5. 10. 15. 20. 25. 30.]
yaxis : YAxis(80.0, 52.8)
yaxis_transform : BlendedGenericTransform(
BboxTransformTo(
TransformedBbox(
Bbox(x0=0.125, y0=0.10999999999999999, x1=0.9, y1=0.88),
BboxTransformTo(
TransformedBbox(
Bbox(x0=0.0, y0=0.0, x1=6.4, y1=4.8),
Affine2D(
[[100. 0. 0.]
[ 0. 100. 0.]
[ 0. 0. 1.]]))))),
CompositeGenericTransform(
TransformWrapper(
BlendedAffine2D(
IdentityTransform(),
IdentityTransform())),
CompositeGenericTransform(
BboxTransformFrom(
TransformedBbox(
Bbox(x0=0.0, y0=0.0, x1=30.0, y1=16.0),
TransformWrapper(
BlendedAffine2D(
IdentityTransform(),
IdentityTransform())))),
BboxTransformTo(
TransformedBbox(
Bbox(x0=0.125, y0=0.10999999999999999, x1=0.9, y1=0.88),
BboxTransformTo(
TransformedBbox(
Bbox(x0=0.0, y0=0.0, x1=6.4, y1=4.8),
Affine2D(
[[100. 0. 0.]
[ 0. 100. 0.]
[ 0. 0. 1.]]))))))))
ybound : (0.0, 16.0)
ygridlines : <a list of 9 Line2D gridline objects>
ylabel :
ylim : (0.0, 16.0)
ymajorticklabels : <a list of 9 Text major ticklabel objects>
yminorticklabels : <a list of 0 Text minor ticklabel objects>
yscale : linear
yticklabels : <a list of 9 Text major ticklabel objects>
yticklines : <a list of 18 Line2D ticklines objects>
yticks : [ 0. 2. 4. 6. 8. 10. 12. 14. 16.]
zorder : 0
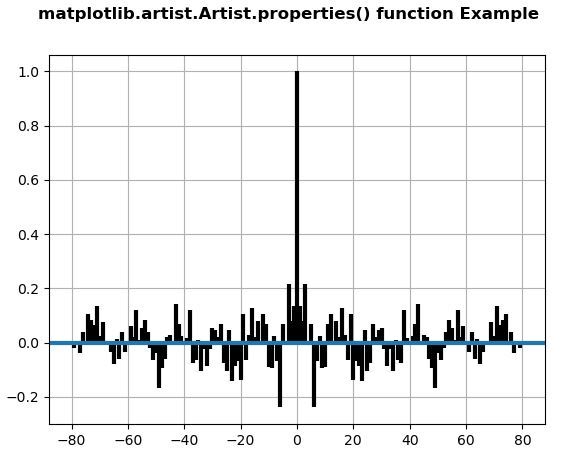
Example 2:
Python3 1==
# Implementation of matplotlib function
from matplotlib.artist import Artist
import matplotlib.pyplot as plt
import numpy as np


np.random.seed(10**7)
geeks = np.random.randn(100)

fig, ax = plt.subplots()
ax.acorr(geeks, usevlines = True,
         normed = True,
         maxlags = 80, lw = 3)

ax.grid(True)

w = Artist.properties(ax)
print("Display all Properties\n")
for i in w:
    print(i, ":", w[i])

fig.suptitle('matplotlib.artist.Artist.properties() \
function Example', fontweight ="bold")

plt.show()
Display all Properties
adjustable : box
agg_filter : None
alpha : None
anchor : C
animated : False
aspect : auto
autoscale_on : True
autoscalex_on : True
autoscaley_on : True
axes_locator : None
axisbelow : line
children : [<matplotlib.collections.LineCollection object at 0x0AAE84F0>, <matplotlib.lines.Line2D object at 0x0AAE84D0>, <matplotlib.spines.Spine object at 0x08151F50>, <matplotlib.spines.Spine object at 0x08151FF0>, <matplotlib.spines.Spine object at 0x081670B0>, <matplotlib.spines.Spine object at 0x08167150>, <matplotlib.axis.XAxis object at 0x08151ED0>, <matplotlib.axis.YAxis object at 0x081673D0>, Text(0.5, 1.0, ''), Text(0.0, 1.0, ''), Text(1.0, 1.0, ''), <matplotlib.patches.Rectangle object at 0x0817CDF0>]
clip_box : None
clip_on : True
clip_path : None
contains : None
data_ratio : 0.007741698372824119
default_bbox_extra_artists : [<matplotlib.collections.LineCollection object at 0x0AAE84F0>, <matplotlib.lines.Line2D object at 0x0AAE84D0>, <matplotlib.spines.Spine object at 0x08151F50>, <matplotlib.spines.Spine object at 0x08151FF0>, <matplotlib.spines.Spine object at 0x081670B0>, <matplotlib.spines.Spine object at 0x08167150>, <matplotlib.axis.XAxis object at 0x08151ED0>, <matplotlib.axis.YAxis object at 0x081673D0>, Text(0.5, 1.0, ''), Text(0.0, 1.0, ''), Text(1.0, 1.0, ''), <matplotlib.patches.Rectangle object at 0x0817CDF0>]
facecolor : (1.0, 1.0, 1.0, 1.0)
fc : (1.0, 1.0, 1.0, 1.0)
figure : Figure(640x480)
frame_on : True
geometry : (1, 1, 1)
gid : None
gridspec : GridSpec(1, 1)
images : <a list of 0 AxesImage objects>
in_layout : True
label :
legend : None
legend_handles_labels : ([], [])
lines : <a list of 1 Line2D objects>
navigate : True
navigate_mode : None
path_effects : []
picker : None
position : Bbox(x0=0.125, y0=0.10999999999999999, x1=0.9, y1=0.88)
rasterization_zorder : None
rasterized : None
renderer_cache : None
shared_x_axes : <matplotlib.cbook.Grouper object at 0x07FDCDB0>
shared_y_axes : <matplotlib.cbook.Grouper object at 0x07FE8BF0>
sketch_params : None
snap : None
subplotspec : <matplotlib.gridspec.SubplotSpec object at 0x07358F70>
title :
transform : IdentityTransform()
transformed_clip_path_and_affine : (None, None)
url : None
visible : True
window_extent : TransformedBbox(
Bbox(x0=0.125, y0=0.10999999999999999, x1=0.9, y1=0.88),
BboxTransformTo(
TransformedBbox(
Bbox(x0=0.0, y0=0.0, x1=6.4, y1=4.8),
Affine2D(
[[100. 0. 0.]
[ 0. 100. 0.]
[ 0. 0. 1.]]))))
xaxis : XAxis(80.0, 52.8)
xaxis_transform : BlendedGenericTransform(
CompositeGenericTransform(
TransformWrapper(
BlendedAffine2D(
IdentityTransform(),
IdentityTransform())),
CompositeGenericTransform(
BboxTransformFrom(
TransformedBbox(
Bbox(x0=-88.0, y0=-0.300605326634452, x1=88.0, y1=1.061933586982593),
TransformWrapper(
BlendedAffine2D(
IdentityTransform(),
IdentityTransform())))),
BboxTransformTo(
TransformedBbox(
Bbox(x0=0.125, y0=0.10999999999999999, x1=0.9, y1=0.88),
BboxTransformTo(
TransformedBbox(
Bbox(x0=0.0, y0=0.0, x1=6.4, y1=4.8),
Affine2D(
[[100. 0. 0.]
[ 0. 100. 0.]
[ 0. 0. 1.]]))))))),
BboxTransformTo(
TransformedBbox(
Bbox(x0=0.125, y0=0.10999999999999999, x1=0.9, y1=0.88),
BboxTransformTo(
TransformedBbox(
Bbox(x0=0.0, y0=0.0, x1=6.4, y1=4.8),
Affine2D(
[[100. 0. 0.]
[ 0. 100. 0.]
[ 0. 0. 1.]]))))))
xbound : (-88.0, 88.0)
xgridlines : <a list of 11 Line2D gridline objects>
xlabel :
xlim : (-88.0, 88.0)
xmajorticklabels :<a list of 11 Text major ticklabel objects>
xminorticklabels : <a list of 0 Text minor ticklabel objects>
xscale : linear
xticklabels : <a list of 11 Text major ticklabel objects>
xticklines : <a list of 22 Line2D ticklines objects>
xticks : [-100. -80. -60. -40. -20. 0. 20. 40. 60. 80. 100.]
yaxis : YAxis(80.0, 52.8)
yaxis_transform : BlendedGenericTransform(
BboxTransformTo(
TransformedBbox(
Bbox(x0=0.125, y0=0.10999999999999999, x1=0.9, y1=0.88),
BboxTransformTo(
TransformedBbox(
Bbox(x0=0.0, y0=0.0, x1=6.4, y1=4.8),
Affine2D(
[[100. 0. 0.]
[ 0. 100. 0.]
[ 0. 0. 1.]]))))),
CompositeGenericTransform(
TransformWrapper(
BlendedAffine2D(
IdentityTransform(),
IdentityTransform())),
CompositeGenericTransform(
BboxTransformFrom(
TransformedBbox(
Bbox(x0=-88.0, y0=-0.300605326634452, x1=88.0, y1=1.061933586982593),
TransformWrapper(
BlendedAffine2D(
IdentityTransform(),
IdentityTransform())))),
BboxTransformTo(
TransformedBbox(
Bbox(x0=0.125, y0=0.10999999999999999, x1=0.9, y1=0.88),
BboxTransformTo(
TransformedBbox(
Bbox(x0=0.0, y0=0.0, x1=6.4, y1=4.8),
Affine2D(
[[100. 0. 0.]
[ 0. 100. 0.]
[ 0. 0. 1.]]))))))))
ybound : (-0.300605326634452, 1.061933586982593)
ygridlines : <a list of 9 Line2D gridline objects>
ylabel :
ylim : (-0.300605326634452, 1.061933586982593)
ymajorticklabels : <a list of 9 Text major ticklabel objects>
yminorticklabels : <a list of 0 Text minor ticklabel objects>
yscale : linear
yticklabels : <a list of 9 Text major ticklabel objects>
yticklines : <a list of 18 Line2D ticklines objects>
yticks : [-0.4 -0.2 0. 0.2 0.4 0.6 0.8 1. 1.2]
zorder : 0
Similar Reads
Python Tutorial - Learn Python Programming Language Python is one of the most popular programming languages. It’s simple to use, packed with features and supported by a wide range of libraries and frameworks. Its clean syntax makes it beginner-friendly. It'sA high-level language, used in web development, data science, automation, AI and more.Known fo
10 min read
Python Interview Questions and Answers Python is the most used language in top companies such as Intel, IBM, NASA, Pixar, Netflix, Facebook, JP Morgan Chase, Spotify and many more because of its simplicity and powerful libraries. To crack their Online Assessment and Interview Rounds as a Python developer, we need to master important Pyth
15+ min read
Python OOPs Concepts Object Oriented Programming is a fundamental concept in Python, empowering developers to build modular, maintainable, and scalable applications. By understanding the core OOP principles (classes, objects, inheritance, encapsulation, polymorphism, and abstraction), programmers can leverage the full p
11 min read
Python Projects - Beginner to Advanced Python is one of the most popular programming languages due to its simplicity, versatility, and supportive community. Whether you’re a beginner eager to learn the basics or an experienced programmer looking to challenge your skills, there are countless Python projects to help you grow.Here’s a list
10 min read
Python Exercise with Practice Questions and Solutions Python Exercise for Beginner: Practice makes perfect in everything, and this is especially true when learning Python. If you're a beginner, regularly practicing Python exercises will build your confidence and sharpen your skills. To help you improve, try these Python exercises with solutions to test
9 min read
Python Programs Practice with Python program examples is always a good choice to scale up your logical understanding and programming skills and this article will provide you with the best sets of Python code examples.The below Python section contains a wide collection of Python programming examples. These Python co
11 min read
Python Introduction Python was created by Guido van Rossum in 1991 and further developed by the Python Software Foundation. It was designed with focus on code readability and its syntax allows us to express concepts in fewer lines of code.Key Features of PythonPython’s simple and readable syntax makes it beginner-frien
3 min read
Python Data Types Python Data types are the classification or categorization of data items. It represents the kind of value that tells what operations can be performed on a particular data. Since everything is an object in Python programming, Python data types are classes and variables are instances (objects) of thes
9 min read
Input and Output in Python Understanding input and output operations is fundamental to Python programming. With the print() function, we can display output in various formats, while the input() function enables interaction with users by gathering input during program execution. Taking input in PythonPython input() function is
8 min read
Enumerate() in Python enumerate() function adds a counter to each item in a list or other iterable. It turns the iterable into something we can loop through, where each item comes with its number (starting from 0 by default). We can also turn it into a list of (number, item) pairs using list().Let's look at a simple exam
3 min read