PySpark Count Distinct from DataFrame
Last Updated :
06 Apr, 2022
In this article, we will discuss how to count distinct values present in the Pyspark DataFrame.
In Pyspark, there are two ways to get the count of distinct values. We can use distinct() and count() functions of DataFrame to get the count distinct of PySpark DataFrame. Another way is to use SQL countDistinct() function which will provide the distinct value count of all the selected columns. Let's understand both the ways to count distinct from DataFrame with examples.
Method 1: distinct().count():
The distinct and count are the two different functions that can be applied to DataFrames. distinct() will eliminate all the duplicate values or records by checking all columns of a Row from DataFrame and count() will return the count of records on DataFrame. By chaining these two functions one after the other we can get the count distinct of PySpark DataFrame.
Example 1: Pyspark Count Distinct from DataFrame using distinct().count()
In this example, we will create a DataFrame df which contains Student details like Name, Course, and Marks. The DataFrame contains some duplicate values also. And we will apply the distinct().count() to find out all the distinct values count present in the DataFrame df.
Python3
# importing module
import pyspark

# importing sparksession from
# pyspark.sql module
from pyspark.sql import SparkSession

# creating sparksession and giving
# app name
spark = SparkSession.builder.appName('sparkdf').getOrCreate()

# giving rows value for dataframe
data = [("Ram", "MCA", 80),
        ("Riya", "MBA", 85),
        ("Jiya", "B.E", 60),
        ("Maria", "B.Tech", 65),
        ("Shreya", "B.sc", 91),
        ("Ram", "MCA", 80),
        ("John", "M.E", 85),
        ("Shyam", "BA", 70),
        ("Kumar", "B.sc", 78),
        ("Maria", "B.Tech", 65)]

# giving column names of dataframe
columns = ["Name", "Course", "Marks"]

# creating a dataframe df
df = spark.createDataFrame(data, columns)

# show df
df.show()

# counting the total number of values
# in df
print("Total number of records in df:", df.count())
Output:
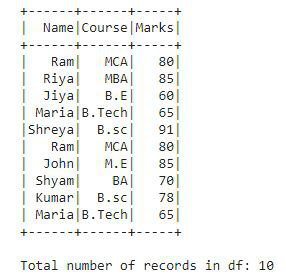
This is the DataFrame df that we have created, and it contains total of 10 records. Now, we apply distinct().count() to find out the total distinct value count present in the DataFrame df.
Python3
# applying distinct().count() on df
print('Distinct count in DataFrame df is :', df.distinct().count())
Output:
Distinct count in DataFrame df is : 8
In this output, we can see that there are 8 distinct values present in the DataFrame df.
Method 2: countDistinct():
This function provides the count of distinct elements present in a group of selected columns. countDistinct() is an SQL function that will provide the distinct value count of all the selected columns.
Example 1: Pyspark Count Distinct from DataFrame using countDistinct().
In this example, we will create a DataFrame df that contains employee details like Emp_name, Department, and Salary. The DataFrame contains some duplicate values also. And we will apply the countDistinct() to find out all the distinct values count present in the DataFrame df.
Python3
# importing sparksession from
# pyspark.sql module
from pyspark.sql import SparkSession

# creating sparksession and giving
# app name
spark = SparkSession.builder.appName('sparkdf').getOrCreate()

# giving rows value for dataframe
data = [("Ram", "IT", 80000),
        ("Shyam", "Sales", 70000),
        ("Jiya", "Sales", 60000),
        ("Maria", "Accounts", 65000),
        ("Ramesh", "IT", 80000),
        ("John", "Management", 80000),
        ("Shyam", "Sales", 70000),
        ("Kumar", "Sales", 78000),
        ("Maria", "Accounts", 65000)]

# giving column names of dataframe
columns = ["Emp_name", "Depart", "Salary"]

# creating a dataframe df
df = spark.createDataFrame(data, columns)

# show df
df.show()

# counting the total number of values in df
print("Total number of records in df:", df.count())

This is the DataFrame df that we have created, and it contains total of 9 records. Now, we will apply countDistinct() to find out the total distinct value count present in the DataFrame df. To apply this function we will import the function from pyspark.sql.functions module.
Python3
# importing countDistinct from
# pyspark.sql.functions
from pyspark.sql.functions import countDistinct

# applying the function countDistinct()
# on df using select()
df2 = df.select(countDistinct("Emp_name", "Depart", "Salary"))

# show df2
df2.show()
Output:
+----------------------------------------+
|count(DISTINCT Emp_name, Depart, Salary)|
+----------------------------------------+
|                                       7|
+----------------------------------------+
There are 7 distinct records present in DataFrame df. The countDistinct() provides the distinct count value in the column format as shown in the output as it's an SQL function.
Now, let's see the distinct values count based on one particular column. We will count the distinct values present in the Department column of employee details df.
Python3
# importing countDistinct from
# pyspark.sql.functions
from pyspark.sql.functions import countDistinct

# applying the function countDistinct()
# on df using select()
df3 = df.select(countDistinct("Depart"))

# show df2
df3.show()
Output:
+----------------------+
|count(DISTINCT Depart)|
+----------------------+
|                     4|
+----------------------+
There are 4 distinct values present in the department column. In this example, we have applied countDistinct() only on Depart column.
Example 2: Pyspark Count Distinct from DataFrame using SQL query.
In this example, we have created a dataframe containing employee details like Emp_name, Depart, Age, and Salary. Now, we will count the distinct records in the dataframe using a simple SQL query as we use in SQL. Let's see the example and understand it:
Python3
# importing sparksession from pyspark.sql module
from pyspark.sql import SparkSession

# creating sparksession and giving app name
spark = SparkSession.builder.appName('sparkdf').getOrCreate()

# giving rows value for dataframe
data = [("Ram", "IT", 44, 80000),
        ("Shyam", "Sales", 45, 70000),
        ("Jiya", "Sales", 30, 60000),
        ("Maria", "Accounts", 29, 65000),
        ("Ram", "IT", 38, 80000),
        ("John", "Management", 35, 80000),
        ("Shyam", "Sales", 45, 70000),
        ("Kumar", "Sales", 27, 70000),
        ("Maria", "Accounts", 32, 65000),
        ("Ria", "Management", 32, 65000)]

# giving column names of dataframe
columns = ["Emp_name", "Depart", "Age", "Salary"]

# creating a dataframe df
df = spark.createDataFrame(data, columns)

# show df
df.show()

# counting the total number of values in df
print("Total number of records in df:", df.count())
Output:

This is the dataframe that contains total of 10 records along with some duplicate records also. Now, we will use an SQL query and find out how many distinct records are found in this dataframe. It is as simple as we do in SQL.
Python3
# creating a temporary view of
# Dataframe and storing it into df2
df.createOrReplaceTempView("df2")

# using the SQL query to count all
# distinct records and display the
# count on the screen
spark.sql("select count(distinct(*)) from df2").show()
Output:
+---------------------------------------------+
|count(DISTINCT Emp_name, Depart, Age, Salary)|
+---------------------------------------------+
|                                            9|
+---------------------------------------------+
There are 9 distinct records found in the entire dataframe df.
Now let's find the distinct values count in two columns i.e. Emp_name and Salary using the below SQL query.
Python3
# using the SQL query to count distinct
# records in 2 columns only display the
# count on the screen
spark.sql("select count(distinct(Emp_name, Salary)) from df2").show()
Output:
+----------------------------------------------------------------+
|count(DISTINCT named_struct(Emp_name, Emp_name, Salary, Salary))|
+----------------------------------------------------------------+
|                                                               7|
+----------------------------------------------------------------+
There are 7 distinct values found in Emp_name and Salary column.
As SQL provides the output of all the operations performed on the data in the tabular format. We got the answer in the column that contains two rows, the first row has the heading, and second row contains a distinct count of records. In Example2 also got output in the same format as, countDistinct() is also an SQL function.
Similar Reads
Create PySpark dataframe from dictionary
In this article, we are going to discuss the creation of Pyspark dataframe from the dictionary. To do this spark.createDataFrame() method method is used. This method takes two argument data and columns. The data attribute will contain the dataframe and the columns attribute will contain the list of
2 min read
Show distinct column values in PySpark dataframe
In this article, we are going to display the distinct column values from dataframe using pyspark in Python. For this, we are using distinct() and dropDuplicates() functions along with select() function. Let's create a sample dataframe. Python3 # importing module import pyspark # importing sparksessi
2 min read
Create PySpark dataframe from nested dictionary
In this article, we are going to discuss the creation of Pyspark dataframe from the nested dictionary. We will use the createDataFrame() method from pyspark for creating DataFrame. For this, we will use a list of nested dictionary and extract the pair as a key and value. Select the key, value pairs
2 min read
PySpark - Select Columns From DataFrame
In this article, we will discuss how to select columns from the pyspark dataframe. To do this we will use the select() function. Syntax: dataframe.select(parameter).show() where, dataframe is the dataframe nameparameter is the column(s) to be selectedshow() function is used to display the selected
2 min read
PySpark - Create DataFrame from List
In this article, we are going to discuss how to create a Pyspark dataframe from a list. To do this first create a list of data and a list of column names. Then pass this zipped data to spark.createDataFrame() method. This method is used to create DataFrame. The data attribute will be the list of da
2 min read
Convert PySpark dataframe to list of tuples
In this article, we are going to convert the Pyspark dataframe into a list of tuples. The rows in the dataframe are stored in the list separated by a comma operator. So we are going to create a dataframe by using a nested list Creating Dataframe for demonstration: Python3 # importing module import p
2 min read
Select columns in PySpark dataframe
In this article, we will learn how to select columns in PySpark dataframe. Function used: In PySpark we can select columns using the select() function. The select() function allows us to select single or multiple columns in different formats. Syntax: dataframe_name.select( columns_names ) Note: We
4 min read
PySpark Dataframe distinguish columns with duplicated name
In this article, we are going to learn how to distinguish columns with duplicated names in the Pyspark data frame in Python. A dispersed collection of data grouped into named columns is known as the Pyspark data frame. While working in Pyspark, there occurs various situations in which we get the dat
5 min read
Remove duplicates from a dataframe in PySpark
In this article, we are going to drop the duplicate data from dataframe using pyspark in Python Before starting we are going to create Dataframe for demonstration: Python3 # importing module import pyspark # importing sparksession from pyspark.sql module from pyspark.sql import SparkSession # creati
2 min read
Pivot String column on Pyspark Dataframe
Pivoting in data analysis refers to the transformation of data from a long format to a wide format by rotating rows into columns. In PySpark, pivoting is used to restructure DataFrames by turning unique values from a specific column (often categorical) into new columns, with the option to aggregate
4 min read