pydash - Python App For Monitoring Linux Server
Last Updated :
09 Apr, 2021
Python and Django with Chart.js make up pydash, a lightweight web-based monitoring application for Linux. It has been tested and can run on CentOS, Fedora, Ubuntu, Debian, Arch Linux, Raspbian, and Pidora, among other popular Linux distributions.
You can use it to monitor the resources on your Linux PC/server, such as CPUs, RAM, network statistics, processes, online users, and more. The dashboard was built entirely with Python libraries from the main Python distribution, so it only has a few dependencies and doesn't require the installation of many packages or libraries.
Installing Pydash in Linux
First, we need to install pip3 and git if you already have you can skip this step:
$ sudo apt-get install python-pip
 Installing pip
Now install git using the below command:
$ sudo apt-get install git
 Installing git
Now we need to install virtualenv:
Virtualenv: When it comes to dealing with dependencies in your Python projects, virtualenv is the tool to use.
$ pip install virtualenv
 Installing virtualenv
Now clone the pydash directory using the git command:
$ git clone https://gitlab.com/k3oni/pydash
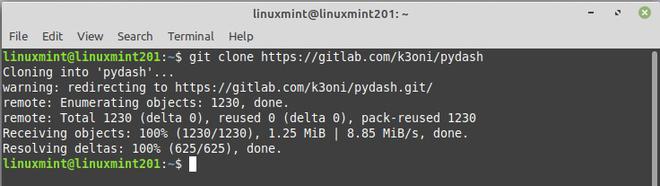 Cloning pydash repository
Change directory to pydash:
 Change directory to pydash
The next move is to use the virtualenv command to create a virtual environment for our project:
$ virtualenv pydashenv
 Creating virtual environment
Now we need to activate our virtual environment using the below command:
$ source /home/ubuntu/paydash/pydashenv/bin/activate
 Activating virtual environment
Now, use the following command to install your project's specifications. It will search in your project for a file called requirements.txt. This is the file in which the creator specifies the packages that must be installed in order for the project to run.
$ pip install -r requirements.txt
 Installing required dependencies
Now we need to change the SECRET_KEY to a custom value, navigate to the pydash directory containing settings.py or simply run the command below to open this file:
$ nano pydash/pydash/settings.py
 Opening setting.py
Search for the SECRET_KEY string and change it to a custom value. Save the file and exit:
 Replace with custom key
Run the Django command using the below command:
$ python manage.py syncdb
When it asks if you want to build a superuser, make sure you choose yes. Then, with the following instruction, run the app.
 Running the Django command
Now that all is ready, run the following command to start the Django development server:
$ python manage.py runserver
 Running server
To access the site dashboard login GUI, open your web browser and type http://127.0.0.1:8000/ into the address bar. Sign in with the super user name and password you created when you created the database and installed Django's authentication system.
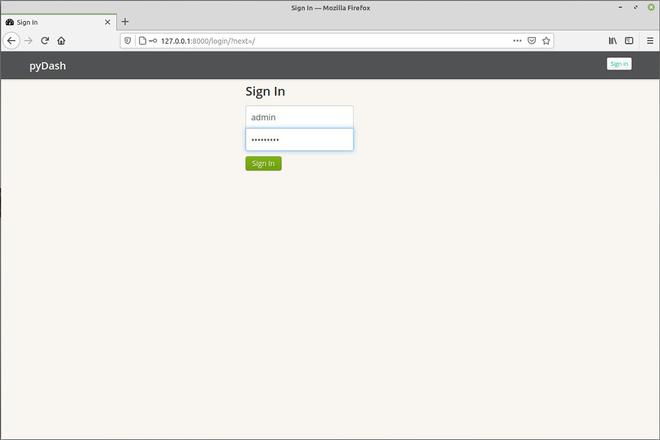 Now login with username and password
When you first log in to the pydash main interface, you'll see a section for tracking general system information, CPU, memory, and disc use, as well as the average system load.
 Pydash
For the time being, that's all there is to it! We demonstrated how to install pydash in Linux in this post. Please let us know your thoughts in the comments section below, and if you know of any other useful and related resources, please let us know as well.
Similar Reads
Sysdig - System Monitoring and Troubleshooting Tool For Linux Sysdig is an open-source, cross-platform, system exploration/diagnosing and troubleshooting tool for Linux. Sysdig was written in Lua program language. Sysdig also has a simple, intuitive, powerful, and fully customizable curses UI (User Interface) called Csysdig. System state and activity from a ru
2 min read
Linux System Monitoring Commands and Tools Monitoring the performance and health of a Linux system is essential for maintaining its stability and optimizing resource utilization. Linux provides a variety of commands and tools to facilitate system monitoring, enabling administrators to track key metrics, identify potential issues, and ensure
6 min read
Mytop - Tool for Monitoring MySQL/MariaDB Performance in Linux Mytop is a completely free and open-source tool that is used for monitoring MySQL and MariaDB databases. It was written in Perl by Jeremy Zawodny. It is almost similar to its counterpart top which is also used for monitoring purposes. Mytop provides the user with a shell through which the user can m
4 min read
AWS CLI for Service Health Monitoring AWS has numerous services, and for your application to run smoothly, it is necessary to keep a check on the status of the services. AWS CLI provides a unified set of commands that enable you to programmatically monitor the health and status of AWS services and resources. Monitoring service health th
6 min read
Network Programming Python - HTTP Server HTTP Web Server is simply a process which runs on a machine and listens for incoming HTTP Requests by a specific IP and Port number, and then sends back a response for the request. Python has a built-in webserver provided by its standard library, can be called for simple client-server communication.
3 min read