In this article, we will put some light on the application named Mitosheet and how we can use it to manipulate Pandas Dataframe easily.
Prerequisite
The user must be familiar with Pandas in Python.
What are Mito and Mitosheet?
Mito is a Data Analysis tool mainly used by data scientists to speed up data analysis using Pandas faster than the traditional way. It is developed by Jacob Diamond Reivich, it's the interface is just like Excel Spreadsheets but it provides a lot more additional benefits, especially for Data Scientists.
Mitosheet is the interface provided by Mito using which we can Manipulate Pandas Dataframe easily.
Installing the required modules -
To be able to use Mitosheet we either need to have Jupyter Notebook or JupyterLab (Google Colab doesn't support this). User can also install it and use it from the windows command prompt.
To install it follow the below steps -
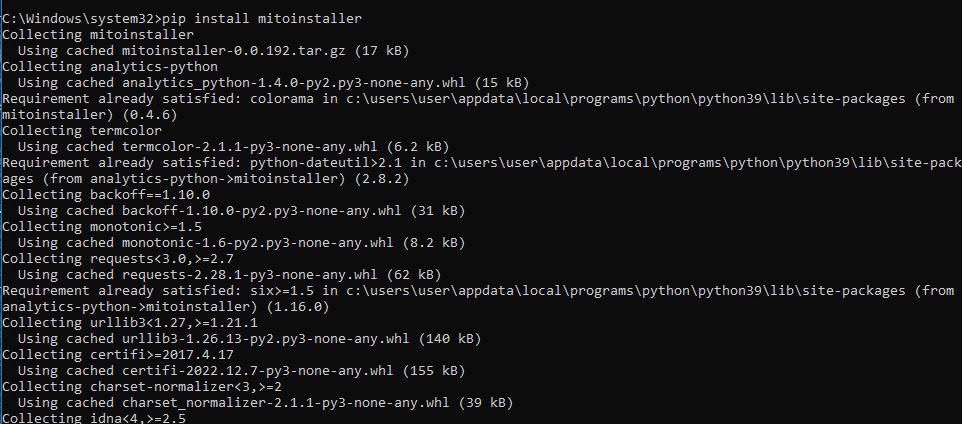
Step 1: Write the following command in the Command Prompt terminal.
pip install mitoinstaller
Step 2: After it has finished then write the below command to install and start the Mitosheet-enabled Jupyterlab. Before executing the following command it is recommended to change the location from cmd to the directory where the dataset i.e the csv file resides.
python -m mitoinstaller install
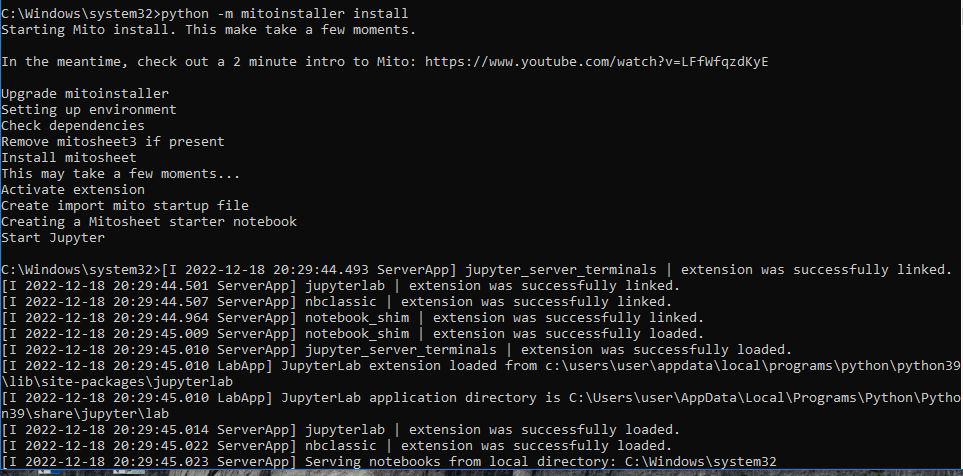
This might take some time (depending on your internet speed and device configuration). After its completion, it will automatically open a Jupyterlab page in the default browser and it will look like the following.

A button like Create New Mitosheet will be visible.
Click on Create New Mitosheet or run the pre-created cell, if that doesn't work or generate Mitosheet then click on the button. The following code will be generated automatically and this output will be shown for the first time. Provide your email and any name for the Organization it doesn't matter.

After filling in the details click Sign Up.

The following empty Mitosheet interface opens -

Now using Pandas we will import a dataset that will be visible in the Mitosheets.
Importing a dataset using Mitosheet
Now after signing up we will import a CSV file using Mitosheet.
After clicking Create New Mitosheet you will see in the Mitosheet interface there is a button called Import.

Click on that and If you have changed the directory location earlier before running the python -m mitoinstaller install command then Import will open that directory where the data resides, otherwise, you need to change the directory manually from the Mitosheet import interface and open the file location and then double click on it.
When you import it you will see there will be an auto-generated pandas code in the below cell. This happens as the changes we will make in the Mitosheet the respective code will be auto-generated in the below cells.

This code auto-generated in the below cell after importing the dataset.

Mito Interface after importing and loading a dataset.
Making changes in the Mitosheet
Now the changes we will make directly in the Mitosheet will be reflected in the below cell, the equivalent pandas code will be generated automatically.
Changing the Column name -
We will change the column name of the first column from Unnamed : 0 to Index directly in the Mitosheet and that equivalent code will be auto-generated in its following cell.
First, select the column whose header we want to change, then double click in the marked area and type the new name and press enter. It's equivalent Python code will be generated in the following cell.

After changing the header and the auto-generated code -


Changing the datatype of a Column -
We can also change the data type of a certain column and that code will be auto-generated too.
Click on the Column whose datatype you want to change, then click on the data type, a new dialog box like below will open -

Now change the Dtype to anything new (select from the dropdown menu). If you want you can also change the NumType from drop down menu to Plain Text, Currency, Percentage etc. Even we can Sort the values in Ascending or Descending order.

All the changes made have been generated, changed the datatype to float, then sorted in Descending order and as it changed to float it has been formatted to 2 decimal places.
Adding a Filter to a Column -
We can add any Filter or a Group of Filter to a Certain Column -
Click on the Funnel Looking icon of any column in which we want to add filter.
Then add any type of filter of user's choice whose code will be generated.

Adding a Filter where only the values greater than 600 will be shown. This not only affects that Column but also the Entire Table / Dataset.

Auto-generated code.
Plotting a Graph
We can easily plot a graph using this.
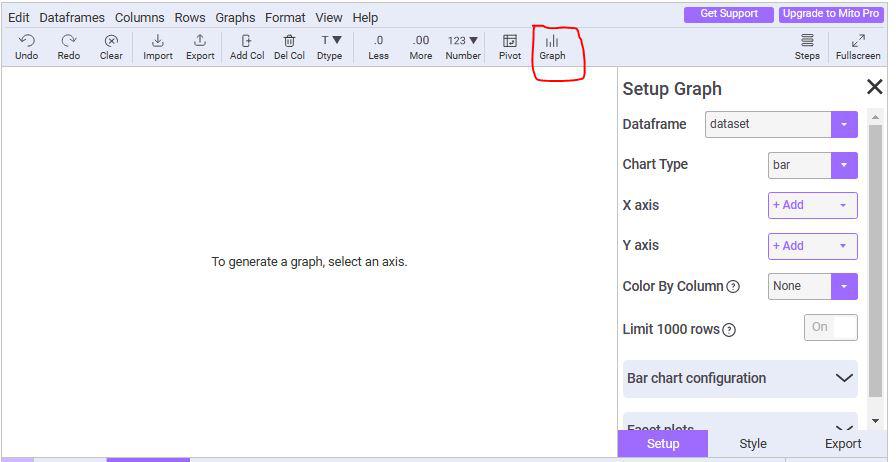
Click on the graph icon and this interface opens. Here we will choose the Dataframe which we want to plot (This is helpful when we have more than one data frame).
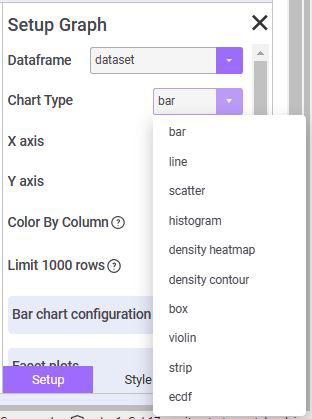
Available types of Charts can be plotted.
We can also change the style of the plots minutely and also export it as png or copy the code which produces the Graph.

Other Features that are available -
Mitosheet consists of all the features that are possible using pandas Dataframe. We can also add a new column to the existing dataframe , Delete any column, export that into either CSV or excel file, make a Pivot table, merge more than one dataframe, and so on.
It doesn't consist of any new features other than the Pandas one, it is just a new GUI that supports all the Pandas functions so those who are not that familiar with Python or Pandas can easily do Data Analysis without the need to write any less to no code.
All the generated codes
from mitosheet import *; register_analysis("id-ybvoydxqbd");

# Imported dataset.csv
import pandas as pd
dataset = pd.read_csv(r'E:\Geeks_Articles\dataset.csv')

# Renamed columns index
dataset.rename(columns={'Unnamed: 0': 'index'}, inplace=True)

# Changed Country to dtype float
dataset['Country'] = dataset['Country'].astype('float')

# Sorted Country in descending order
dataset = dataset.sort_values(by='Country', ascending=False, na_position='last')

# Filtered Country
dataset = dataset[dataset['Country'] > 600]

# Formatted dataframes. View these styling objects to see the formatted dataframe
dataset_styler = dataset.style\
    .format("${:.2f}", subset=['Country'])