ML | Handling Missing Values
Last Updated :
21 Jul, 2025
Missing values are a common challenge in machine learning and data analysis. They occur when certain data points are missing for specific variables in a dataset. These gaps in information can take the form of blank cells, null values or special symbols like "NA", "NaN" or "unknown." If not addressed properly, missing values can harm the accuracy and reliability of our models. They can reduce the sample size, introduce bias and make it difficult to apply certain analysis techniques that require complete data. Efficiently handling missing values is important to ensure our machine learning models produce accurate and unbiased results. In this article, we'll see more about the methods and strategies to deal with missing data effectively.
 Missing Values
Importance of Handling Missing Values
Handling missing values is important for ensuring the accuracy and reliability of data analysis and machine learning models. Key reasons include:
- Improved Model Accuracy: Addressing missing values helps avoid incorrect predictions and boosts model performance.
- Increased Statistical Power: Imputation or removal of missing data allows the use of more analysis techniques, maintaining the sample size.
- Bias Prevention: Proper handling ensures that missing data doesn’t introduce systematic bias, leading to more reliable results.
- Better Decision-Making: A clean dataset leads to more informed, trustworthy decisions based on accurate insights.
Challenges Posed by Missing Values
Missing values can introduce several challenges in data analysis including:
- Reduce sample size: If rows or data points with missing values are removed, it reduces the overall sample size which may decrease the reliability and accuracy of the analysis.
- Bias in Results: When missing data is not handled carefully, it can introduce bias. This is especially problematic when the missingness is not random, leading to misleading conclusions.
- Difficulty in Analysis: Many statistical techniques and machine learning algorithms require complete data for all variables. Missing values can cause certain analyses or models inapplicable, limiting the methods we can use.
Reasons Behind Missing Values in the Dataset
Data can be missing from a dataset for several reasons and understanding the cause is important for selecting the most effective way to handle it. Common reasons for missing data include:
- Technical issues: Failed data collection or errors during data transmission.
- Human errors: Mistakes like incorrect data entry or oversights during data processing.
- Privacy concerns: Missing sensitive or personal information due to confidentiality policies.
- Data processing issues: Errors that occur during data preparation.
By identifying the reason behind the missing data, we can better assess its impact whether it's causing bias or affecting the analysis and select the proper handling method such as imputation or removal.
Types of Missing Values
Missing values in a dataset can be categorized into three main types each with different implications for how they should be handled:
- Missing Completely at Random (MCAR): In this case, the missing data is completely random and unrelated to any other variable in the dataset. The absence of data points occurs without any systematic pattern such as a random technical failure or data omission.
- Missing at Random (MAR): The missingness is related to other observed variables but not to the value of the missing data itself. For example, if younger individuals are more likely to skip a particular survey question, the missingness can be explained by age but not by the content of the missing data.
- Missing Not at Random (MNAR): Here, the probability of missing data is related to the value of the missing data itself. For example, people with higher incomes may be less likely to report their income, leading to a direct connection between the missingness and the value of the missing data.
Methods for Identifying Missing Data
Detecting and managing missing data is important for data analysis. Let's see some useful functions for detecting, removing and replacing null values in Pandas DataFrame.
Functions | Descriptions |
|---|
.isnull() | Identifies missing values in a Series or DataFrame. |
.notnull() | Opposite of .isnull(), returns True for non-missing values and False for missing values. |
.info() | Displays DataFrame summary including data types, memory usage and the count of missing values. |
.isna() | Works similarly to .notnull() but returns True for missing data and False for valid data. |
| dropna() | Removes rows or columns with missing values with customizable options for axis and threshold. |
| fillna() | Fills missing values with a specified value (like mean, median) or method (forward/backward fill). |
| replace() | Replaces specified values in the DataFrame, useful for correcting or standardizing data. |
| drop_duplicates() | Removes duplicate rows based on specified columns. |
| unique() | Finds unique values in a Series or DataFrame. |
For more detail refer to Working with Missing Data in Pandas
Representation of Missing Values in Datasets
Missing values can be represented by blank cells, specific values like "NA" or codes. It's important to use consistent and documented representation to ensure transparency and ease in data handling.
Common representations include:
- Blank Cells: Empty cells in data tables or spreadsheets are used to signify missing values. This is common in many data formats like CSVs.
- Specific Values: It is commonly used placeholders for missing data include "NA", "NaN", "NULL" or even arbitrary values like -999. It’s important to choose a standardized value and document its meaning to prevent confusion.
- Codes or Flags: In some cases, non-numeric codes or flags (e.g "MISSING", "UNKNOWN") are used to show missing data. These can be useful in distinguishing between different types of missingness or categorizing missing data based on its origin.
Strategies for Handling Missing Values in Data Analysis
Depending on the nature of the data and the missingness, several strategies can help maintain the integrity of our analysis. Let's see some of the most effective methods to handle missing values.
Before moving to various strategies, let's first create a Sample Dataframe so that we can use it for different methods.
Creating a Sample Dataframe
Here we will be using Pandas and Numpy libraries.
Python
import pandas as pd
import numpy as np

data = {
    'School ID': [101, 102, 103, np.nan, 105, 106, 107, 108],
    'Name': ['Alice', 'Bob', 'Charlie', 'David', 'Eva', 'Frank', 'Grace', 'Henry'],
    'Address': ['123 Main St', '456 Oak Ave', '789 Pine Ln', '101 Elm St', np.nan, '222 Maple Rd', '444 Cedar Blvd', '555 Birch Dr'],
    'City': ['Los Angeles', 'New York', 'Houston', 'Los Angeles', 'Miami', np.nan, 'Houston', 'New York'],
    'Subject': ['Math', 'English', 'Science', 'Math', 'History', 'Math', 'Science', 'English'],
    'Marks': [85, 92, 78, 89, np.nan, 95, 80, 88],
    'Rank': [2, 1, 4, 3, 8, 1, 5, 3],
    'Grade': ['B', 'A', 'C', 'B', 'D', 'A', 'C', 'B']
}

df = pd.DataFrame(data)
print("Sample DataFrame:")

print(df)
Output:
 Creating a Sample Dataframe
1. Removing Rows with Missing Values
Removing rows with missing values is a simple and straightforward method to handle missing data, used when we want to keep our analysis clean and minimize complexity.
Advantages:
- Simple and efficient: It’s easy to implement and quickly removes data points with missing values.
- Cleans data: It removes potentially problematic data points, ensuring that only complete rows remain in the dataset.
Disadvantages:
- Reduces sample size: When rows are removed, the overall dataset shrinks which can affect the power and accuracy of our analysis.
- Potential bias: If missing data is not random (e.g if certain groups are more likely to have missing values) removing rows could introduce bias.
In this example, we are removing rows with missing values from the original DataFrame (df) using the dropna() method and then displaying the cleaned DataFrame (df_cleaned).
Python
df_cleaned = df.dropna()

print("\nDataFrame after removing rows with missing values:")
print(df_cleaned)
Output:
 Removing Rows with Missing Values
2. Imputation Methods
Imputation involves replacing missing values with estimated values. This approach is beneficial when we want to preserve the dataset’s sample size and avoid losing data points. However, it's important to note that the accuracy of the imputed values may not always be reliable.
Let's see some common imputation methods:
2.1 Mean, Median and Mode Imputation:
This method involves replacing missing values with the mean, median or mode of the relevant variable. It's a simple approach but it doesn't account for the relationships between variables.
In this example, we are explaining the imputation techniques for handling missing values in the 'Marks' column of the DataFrame (df). It calculates and fills missing values with the mean, median and mode of the existing values in that column and then prints the results for observation.
- df['Marks'].fillna(df['Marks'].mean()): Fills missing values in the 'Marks' column with the mean value.
- df['Marks'].fillna(df['Marks'].median()): Fills missing values in the 'Marks' column with the median value.
- df['Marks'].fillna(df['Marks'].mode(): Fills missing values in the 'Marks' column with the mode value.
- .iloc[0]: Accesses the first element of the Series which represents the mode.
Python
mean_imputation = df['Marks'].fillna(df['Marks'].mean())
median_imputation = df['Marks'].fillna(df['Marks'].median())
mode_imputation = df['Marks'].fillna(df['Marks'].mode().iloc[0])

print("\nImputation using Mean:")
print(mean_imputation)

print("\nImputation using Median:")
print(median_imputation)

print("\nImputation using Mode:")
print(mode_imputation)
Output:
 Mean, Median and Mode Imputation
Advantages:
- Simple and efficient: Easy to implement and quick.
- Works well with numerical data: It is useful for numerical variables with a normal distribution.
Disadvantages:
- Inaccuracy: It assumes the missing value is similar to the central tendency (mean/median/mode) which may not always be the case.
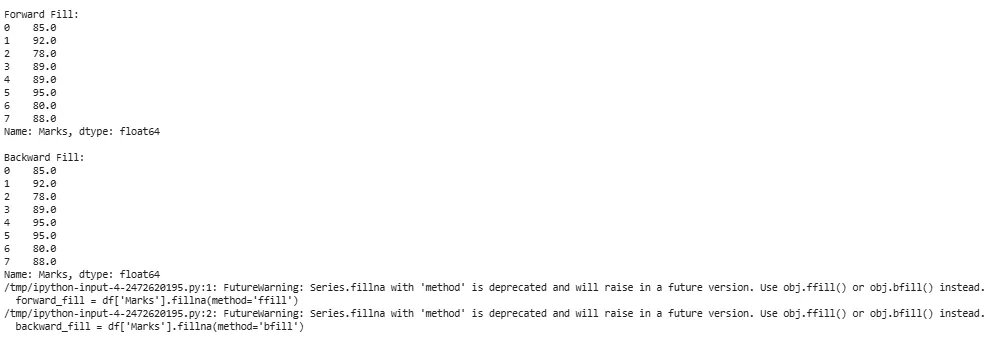
2.2 Forward and Backward Fill
Forward and backward fill techniques are used to replace missing values by filling them with the nearest non-missing values from the same column. This is useful when there’s an inherent order or sequence in the data.
The method parameter in fillna() allows to specify the filling strategy.
- df['Marks'].fillna(method='ffill'): This method fills missing values in the 'Marks' column of the DataFrame (df) using a forward fill strategy. It replaces missing values with the last observed non-missing value in the column.
- df['Marks'].fillna(method='bfill'): This method fills missing values in the 'Marks' column using a backward fill strategy. It replaces missing values with the next observed non-missing value in the column.
Python
forward_fill = df['Marks'].fillna(method='ffill')
backward_fill = df['Marks'].fillna(method='bfill')

print("\nForward Fill:")
print(forward_fill)

print("\nBackward Fill:")
print(backward_fill)
Output:
 Forward and Backward Fill
Advantages:
- Simple and Intuitive: Preserves the temporal or sequential order in data.
- Preserves Patterns: Fills missing values logically, especially in time-series or ordered data.
Disadvantages:
- Assumption of Closeness: Assumes that the missing values are similar to the observed values nearby which may not always be true.
- Potential Inaccuracy: May not work well if there are large gaps between non-missing values.
Note:
- Forward fill uses the last valid observation to fill missing values.
- Backward fill uses the next valid observation to fill missing values.
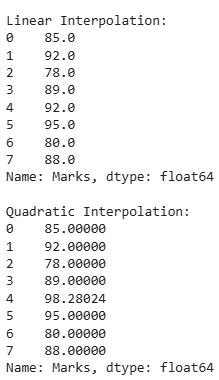
3. Interpolation Techniques
Interpolation is a technique used to estimate missing values based on the values of surrounding data points. Unlike simpler imputation methods (e.g mean, median, mode), interpolation uses the relationship between neighboring values to make more informed estimations.
The interpolate() method in pandas are divided into Linear and Quadratic.
- df['Marks'].interpolate(method='linear'): This method performs linear interpolation on the 'Marks' column of the DataFrame (df).
- df['Marks'].interpolate(method='quadratic'): This method performs quadratic interpolation on the 'Marks' column.
Python
linear_interpolation = df['Marks'].interpolate(method='linear')
quadratic_interpolation = df['Marks'].interpolate(method='quadratic')

print("\nLinear Interpolation:")
print(linear_interpolation)

print("\nQuadratic Interpolation:")
print(quadratic_interpolation)
Output:
 Interpolation techniques
Advantages:
- Sophisticated Approach: Interpolation is more accurate than simple imputation methods like mean or median, as it considers the underlying data structure.
- Preserves Data Relationships: Captures patterns or trends that exist between data points, which helps maintain the integrity of the dataset.
Disadvantages:
- Complexity: Requires more computational resources and additional libraries.
- Assumptions on Data: Assumes that data points follow a specific pattern (e.g., linear or quadratic), which may not always be true.
Note:
- Linear interpolation assumes a straight line between two adjacent non-missing values.
- Quadratic interpolation assumes a quadratic curve that passes through three adjacent non-missing values.
Impact of Handling Missing Values
Handling missing values effectively is important to ensure the accuracy and reliability of our findings.
Let's see some key impacts of handling missing values:
- Improved data quality: A cleaner dataset with fewer missing values is more reliable for analysis and model training.
- Enhanced model performance: Properly handling missing values helps models perform better by training on complete data, leading to more accurate predictions.
- Preservation of Data Integrity: Imputing or removing missing values ensures consistency and accuracy in the dataset, maintaining its integrity for further analysis.
- Reduced bias: Addressing missing values prevents bias in analysis, ensuring a more accurate representation of the underlying patterns in the data.
Effectively handling missing values is important for maintaining data integrity, improving model performance and ensuring reliable analysis. By carefully choosing appropriate strategies for imputation or removal, we increase the quality of our data, minimize bias and maximize the accuracy of our findings.
Similar Reads
Machine Learning Tutorial Machine learning is a branch of Artificial Intelligence that focuses on developing models and algorithms that let computers learn from data without being explicitly programmed for every task. In simple words, ML teaches the systems to think and understand like humans by learning from the data.Do you
5 min read
Introduction to Machine Learning
Python for Machine Learning
Machine Learning with Python TutorialPython language is widely used in Machine Learning because it provides libraries like NumPy, Pandas, Scikit-learn, TensorFlow, and Keras. These libraries offer tools and functions essential for data manipulation, analysis, and building machine learning models. It is well-known for its readability an
5 min read
Pandas TutorialPandas (stands for Python Data Analysis) is an open-source software library designed for data manipulation and analysis. Revolves around two primary Data structures: Series (1D) and DataFrame (2D)Built on top of NumPy, efficiently manages large datasets, offering tools for data cleaning, transformat
6 min read
NumPy Tutorial - Python LibraryNumPy is a core Python library for numerical computing, built for handling large arrays and matrices efficiently.ndarray object – Stores homogeneous data in n-dimensional arrays for fast processing.Vectorized operations – Perform element-wise calculations without explicit loops.Broadcasting – Apply
3 min read
Scikit Learn TutorialScikit-learn (also known as sklearn) is a widely-used open-source Python library for machine learning. It builds on other scientific libraries like NumPy, SciPy and Matplotlib to provide efficient tools for predictive data analysis and data mining.It offers a consistent and simple interface for a ra
3 min read
ML | Data Preprocessing in PythonData preprocessing is a important step in the data science transforming raw data into a clean structured format for analysis. It involves tasks like handling missing values, normalizing data and encoding variables. Mastering preprocessing in Python ensures reliable insights for accurate predictions
6 min read
EDA - Exploratory Data Analysis in PythonExploratory Data Analysis (EDA) is a important step in data analysis which focuses on understanding patterns, trends and relationships through statistical tools and visualizations. Python offers various libraries like pandas, numPy, matplotlib, seaborn and plotly which enables effective exploration
6 min read
Feature Engineering
Supervised Learning
Unsupervised Learning
Model Evaluation and Tuning
Advance Machine Learning Technique
Machine Learning Practice