A linear function is a mathematical function that creates a straight line when graphed. It can be described by the formula:
y = mx + b
In Algebra, a linear function represents astraight line in the 2-D or 3-D cartesian plane. This is why such functions are called "linear." They are functions that involve variables and constants, but no exponent values greater than one.

The general form of a linear function is expressed as:
y = f(x) = mx + c
where,
- y is the Dependent Variable,
- x is the Independent Variable,
- m is the Coefficient of x,
- c is the Constant Value.
Key Characteristics:
- A function whose graph is a straight line is called a linear function.
- It is a polynomial function of degree one (1) because the highest power of the variable x is 1.
- The function relates the dependent variable (y or f(x)) to the independent variable (x) through a linear relationship.
Examples of Linear Function
Various example of the linear function are,
- y = f(x) = 2x + 1
- y = f(x) = -3x - 2
- y = f(x) = 5
Non-Linear Function
A non-linear function is the function that are not linear in nature, i.e. the graph of these function do not represent the straight line. The graph of these functions represents, circle, parabola, hyperbola, etc. These function are called,
- Quadratic Functions,
- Parabolic Functions,
- Hyperbolic Function, etc.
Linear Function Formula is used to represent the objective function of the linear programming problems, which helps to maximize profits or minimize input cost. The data is provided in a LPP is a linear function. In general a linear function, on is in the form, f(x) = ax + b and the purpose of the Linear Programming Problems is to maximize or minimize the linear function under some conditions that are given in the LPP.
How to Find Linear Function
A linear function connecting at least two coordinates is easily found using the point slope form or intercept form of a line. As a linear function is the equation of straight line. It is found using equation of line concept. This is explained in the example added below,
Example: Find the Linear function when two points on the function are, (-1, 2) and (3, 4)
Solution:
Given Points,
- (x1, y1) = (-1, 2)
- (x2, y2) = (3, 4)
Slope of Line(m) = (y2 - y1)/(x2 - x1)
m = (4 - 2)/(3 - {-1}) = 2/4 = 1/2
Now the linear function is,
y - y1 = m(x - x1)
y - 2 = 1/2(x - {-1})
y - 2 = 1/2(x + 1)
2y - 4 = x + 1
x - 2y + 5 = 0
This is the required linear function.
Graphing of a Linear Function
We know that graph of linear equation represents the straight line and to draw a straight line we need at least two point and joining those two points and stretching the line in both the direction gives the required straight line.
The graph of a linear function f(x) = mx + b is shown in the image added below as,
The image added below shows the linear function when m > 0,

The image added below shows the linear function when m < 0,

The image added below shows the linear function when m = 0,

Graphing a Linear Function by Finding Two Points
To discover two pinpoints on a linear function (line) f(x) = mx + b, consider some unexpected values for 'x' and have to replace these values to find the connected values of y.
This method is presented by an instance where we are proceeding to graph the function f(x) = 2x + 4.
Step 1: Find two points on the line by first taking two random value of x
- Let the values be: x = 0 and x = 1
Step2: Find the value of the y with the respective value of the x.
| x | y |
|---|
| 0 | 2(0) + 4 = 4 |
| 1 | 2(1) + 4 = 6 |
So, the two points on the line are (0, 4) and (1, 6).
Step 3: Plot the point on the graph and join them to get the graph of required linear function.

Graphing of Linear Function Using Slope and Y-intercept
To graph a linear function using slope and y-intercept form, we first the linear function in the standard slope as,
f(x) = mx + b
where, m is slope of line and the y intercept is b.
For example, f(x) = 2x + 4
- slope of line = 2
- y-intercept = 4
- point on y-axis = (0, 4)
Now to find plot the line we follow the steps added below,
Step 1: Firstly Plot the y-intercept (0, b) i.e. (0, 4)
Step 2: Now the slope in fraction is represented as rise/run
Here,
slope = 2 = 2/1 = rise/run
So, rise = 2 and run = 1
Step 3: Rise the y-intercept vertically by "rise" and then run horizontally by "run". This results in a new point.
Here, we move 2 units vertically in the direction of y-axis and move horizontally 1 unit in direction of x-axis.
Step 4: Now join the points from Step 1 and Step 3 we get the required graph of linear function.

Domain and Range of Linear Function
Domain of the linear function is the collection of all real numbers, and the range of a linear function is the collection of all numbers that are found by substituting the value of in the linear function.
The general form of the linear function is y = ax + b and if a ≠ 0 then the domain and range of the function is,
- Domain of Linear Function = R
- Range of Linear Function = R
Note: When the slope, m = 0, then the linear function f(x) = b is a horizontal line, and in this case,
Inverse of Linear Function
Inverse of the linear function f(x) = ax + b is represented as by a function f-1(x) such that,
- f(f-1(x)) = f-1(f(x)) = x
Inverse of the function is explained using the example added below,
Example: Find the inverse of f(x) = 2x + 4
Solution:
Step 1: Write the given linear function as,
y = 2x + 4
Step 2: Now interchange the variables x and y
x = 2y + 4
Step 3: Solve the above equation to get y
x - 4 = 2y
y = (x - 4)/2
Step 4: Replace y by f-1(x) and it is the inverse function of f(x).
f-1(x) = (x - 4)/2
Note: f(x) and f-1(x)are always symmetric with respect to the line y = x
Piecewise Linear Function
A function that is linear on some domain of the function or the function that is function in a specific interval of domain is called the Piecewise Linear Function. Example of Piecewise Linear Function is,
- f(x) = 2x, x ∈ [-5, 4)
- f(x) = -x + 11, x ∈ [4, 12]
Read More
Solved Examples on Linear Functions
Example 1: Find the linear function that has two points (-2, 17) and (1, 26) on it.
Solution:
Given Points,
- (x1, y1) = (-2, 17)
- (x2, y2) = (1, 26)
Step1: Firstly find the slope of the function using the slope formula:
m = (y₂ - y₁) / (x₂ - x₁)
m = (26 - 17) / (1 - (-2))
m = 9/3 = 3
Step2: Now find the equation of linear function using the point-slope form
y - y₁ = m (x - x₁)
y - 17 = 3 (x - (-2))
y - 17 = 4 (x + 2)
y - 17 = 4x + 8
y = 4x + 25
So, the equation of linear function is, f(x) = 4x + 25
Example 2: Check whether the data set represents a linear function or not.
Solution:
Plot the points in the table
| X | Y | (Difference in X)/(Difference in Y) |
|---|
3 ⇣+2 5 | 16 ⇣+8 23 | ⇒ 8/2 = 4 |
5 ⇣+2 7 | 23 ⇣+8 31 | ⇒ 8/2 = 4 |
7 ⇣+4 11 | 31 ⇣+16 47 | ⇒ 16/4 = 4 |
11 ⇣+2 13 | 47 ⇣+8 55 | ⇒ 8/2 = 4 |
As all the numbers in the last column are equal, the given table represents the linear function.
Example 3: Plot Linear Function Graph y = 3x + 2
Solution:
Take some value of x and find its corresponding y-values.

| x | y = 3x + 2 |
|---|
| 1 | 3 × 1 + 2 = 5 |
| 2 | 3 × 2 + 2 = 8 |
| 3 | 3 × 3 + 2 = 11 |
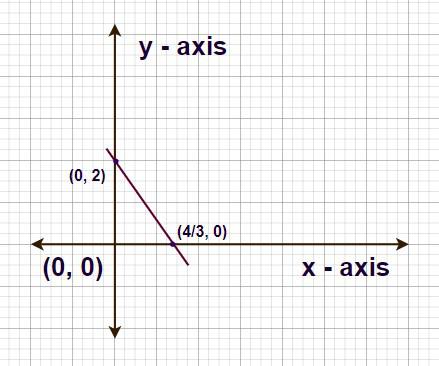
Example 4: Plot the graph of the following equation 3x + 2y − 4 = 0
Solution:
Given Linear Function, 3x + 2y - 4 = 0
3x + 2y = 4
3x/4 + 2y/4 = 1
x/(4/3) + y/(2) = 1
Comparing with x/a + y/b = 1
• a = 4/3
• b = 2
Now, point on x-axis is (a, 0) = (4/3, 0)
Point on y-axis is (0, b) = (0, 2)
Plotting these points on the graph and joining them we get the required linear function.
Practice Questions on Linear Function
Question 1: Plot the graph of the following equation 2x + y − 8 = 0.
Question 2: Plot the graph of the following equation x + y − 1 = 0.
Question 3: Find the linear function that has two points (1, 3) and (-2, 4) on it.
Question 4: Find the linear function that has two points (-1, -2) and (1, 2) on it.
Similar Reads
IBPS Clerk Syllabus of Quantitative Aptitude
IBPS Clerk Exam 2023 Quantitative Aptitude: Quantitative Aptitude is one of the most significant areas of the IBPS Clerk Exam, with 35 questions for 35 marks. The majority of applicants fear Quantitative Aptitude since it requires a lot of calculation and complicated problems that demand high analyt
6 min read
Ratio & Proportion, Percentage
Time and Work - Aptitude Questions and Answers
Time and Work is one of the most basic concepts in Quantitative Aptitude, which is tested extensively in government exams. Undoubtedly, having a strong background in this topic can give candidates an upper hand and help them to score well in competitive exams. A candidate needs to be aware of the ba
14 min read
Surface Areas and Volumes
Surface Area and Volume are two fundamental properties of a three-dimensional (3D) shape that help us understand and measure the space they occupy and their outer surfaces. Knowing how to determine surface area and volumes can be incredibly practical and handy in cases where you want to calculate th
10 min read
Bar Graphs, Linear Graphs and Pie Charts
Trigonometry, Height and Distances
Height and Distance | Applications of Trigonometry
Height is the measurement of an item in the vertical direction, whereas distance is the measurement of an object in the horizontal direction. Heights and Distances are the real-life applications of trigonometry which is useful to astronomers, navigators, architects, surveyors, etc. in solving proble
7 min read
Trigonometric Ratios
There are three sides of a triangle Hypotenuse, Adjacent, and Opposite. The ratios between these sides based on the angle between them is called Trigonometric Ratio. The six trigonometric ratios are: sine (sin), cosine (cos), tangent (tan), cotangent (cot), cosecant (cosec), and secant (sec). As giv
4 min read
Trigonometry in Math
We use trigonometry in many everyday situations, often without even noticing. Construction and Architecture: Trigonometry helps calculate angles and heights when designing buildings, bridges, and roads. For example, architects use it to determine roof slopes or the angle of staircases.Navigation: Pi
3 min read