How to Use Azure Monitor to Observe and Diagnose a JavaScript Error?
Last Updated :
19 Sep, 2023
JavaScript is a very versatile language but still errors can occur, main to sudden conduct and personal dissatisfaction. Microsoft Azure offers an effective device referred to as Azure Monitor, which allows developers to identify, look at, and diagnose JavaScript errors effectively. In this text, we will explore how to use Azure Monitor to display, stumble on, and solve JavaScript mistakes in Azure-based total packages.
What is Azure Monitor
Azure Monitor is a comprehensive tracking and control answer provided by using Microsoft Azure for monitoring the overall performance, health, and availability of applications, infrastructure, and services for your Azure surroundings. It offers a set of equipment and functions that help you acquire telemetry information, benefit insights into your resources' conduct, and take proactive movements to make sure optimum performance and reliability.
Azure Monitor performs a crucial function in maintaining the reliability and overall performance of packages and offerings hosted within the Azure cloud. It facilitates corporations become aware of and deal with troubles early, providing a higher experience for users and allowing greater green useful resource control.
Key Features and Abilities of Azure Monitor
- Telemetry Collection: Azure Monitor collects telemetry statistics from various assets, which include programs, virtual machines, containers, and different Azure offerings. This data includes metrics, logs, traces, and other relevant data that offer insights into the conduct of your resources.
- Logs and Diagnostics: Azure Monitor provides log collection and evaluation capabilities via Azure Monitor Logs (formerly called Log Analytics). This feature enables you to centralize logs from exclusive resources, query the facts the use of a effective question language, and installation signals based totally on log activities.
- Application Insights: Part of Azure Monitor, Application Insights is a tool designed mainly for tracking the overall performance of packages. It permits you to music consumer interactions, diagnose performance troubles, and perceive traits the use of statistics together with requests, dependencies, and exceptions.
- Alerts and Notifications: Azure Monitor permits you to create and configure signals based totally on metrics and log information. When situations meet unique thresholds, indicators can trigger notifications thru diverse channels like e-mail, SMS, and integrations with communique platforms.
- Auto-scaling: By the use of insights from Azure Monitor, you can implement car-scaling techniques. Azure can dynamically regulate the potential of your sources based totally on factors like CPU usage or reaction times, ensuring most excellent performance even as minimizing fees.
What is Microsoft Azure?
Microsoft Azure affords an entire monitoring solution called Azure Monitor. It permits programmers to gather, look at, and take motion on telemetry records from special Azure resources and apps. Azure Monitor is an important tool for ensuring the quality and overall performance of your packages as it allows for the monitoring of software's overall performance, infrastructure health, and other facts.
How to Enable Azure Monitor for JavaScript Error Monitoring?
To begin tracking JavaScript errors on your Azure-primarily based programs, comply with the steps:
Create an Application Insights: Azure Monitor has a device called Application Insights that video display units the overall performance of programs. Begin by creating an Application Insights aid within the Azure portal.
1. Click on Application Button
[caption width="800"]
 Click on Application Button[/caption]
2. Create an application insight
[caption width="800"]
 Create an application insight[/caption]
3. Give a unique name for your Application Insights resource
[caption width="800"]
 Give a unique name f[/caption]
Instrument your JavaScript utility: Integrate the Application Insights JavaScript SDK into your web utility. It may be used in numerous JavaScript frameworks and libraries like React, Angular, or simple JavaScript.
1. Add application insight
[caption width="800"]
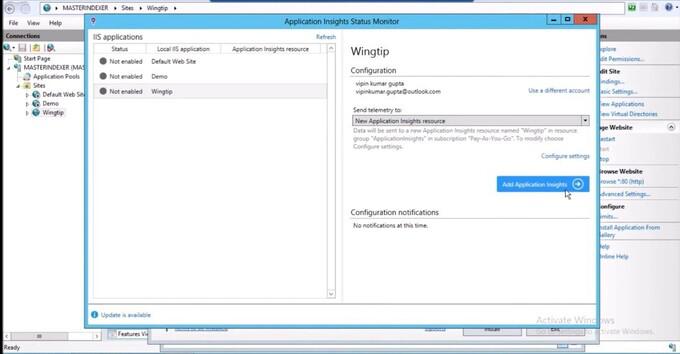 Add application insight[/caption]
Configure error tracking: Once you've got instrumented your software, configure error monitoring to display JavaScript mistakes. The SDK will mechanically acquire statistics about unhandled exceptions and JavaScript errors.
[caption width="800"]
 Configure error tracking[/caption]
Monitor Your application Insight: . Once your application is instrumented and actively sending telemetry data to Application Insights
[caption width="800"]
 Monitor Your application Insight[/caption]
How to Identify JavaScript Errors in Azure Monitor?
Azure Monitor affords diverse tools and dashboards to become aware of and study JavaScript mistakes correctly:
- Application Insights Overview Dashboard: It will provide you with an outline of the number of JavaScript errors, the affected customers, and their locations.
- Failures Blade: The Failures Blade gives exact information approximately failed requests, along with JavaScript errors.
- Performance Blade: The Performance Blade facilitates you analyze the performance of your utility and detect any correlation among performance troubles and JavaScript mistakes.
How to Resolve JavaScript Errors?
- Detailed mistakes records: Application Insights captures distinctive errors records, together with the error message, stack hint, and affected users. This records is vital for knowledge the root reason of the error.
- Alerts and Notifications: Configure alerts to be notified when the number of JavaScript errors exceeds a targeted threshold. It can deliver notification via any medium like Email, SMS and so on.
- Continuous Improvement: Continuously examine the JavaScript errors statistics to perceive styles and recurring troubles.
Performance Optimization Techniques
Optimizing your utility's performance can lessen the prevalence of JavaScript mistakes:
- Minification and compression: By minimizing the quantity of your JavaScript code, you may speed up page masses and lessen the chance that mistakes will get up because of slow community connections.
- Caching Techniques: Use caching techniques for your JavaScript documents to lessen server queries and improve the responsiveness of the utility.
- Browser Compatibility: Test your utility throughout many browsers and browser variations to make certain JavaScript problems are not unique to particular setups.
Best Practices and Tips
Here are some best practices and guidelines for efficiently using Azure Monitor to take a look at and diagnose JavaScript mistakes:
- Enable Detailed Error Tracking: Ensure that you permit specified mistakes tracking inside the Application Insights SDK for JavaScript. This putting permits you to seize stack traces and additional context information, making it less difficult to diagnose and fasten JavaScript mistakes as it should be.
- Set Realistic Alert Thresholds: When configuring alerts for JavaScript mistakes, set alert thresholds which are realistic and applicable to your software's overall performance. Setting thresholds too low may generate excessive fake indicators, while placing them too excessive may want to cause essential errors being disregarded.
- Monitor Error Rates over Time: Keep a close eye on the fashion of JavaScript blunders fees over the years. This will assist you identify any increasing developments or styles that can require immediate attention.
- Utilize Smart Detection: Leverage Azure Monitor's Smart Detection characteristic to automatically hit upon anomalies in your utility's conduct. This allow you to proactively pick out JavaScript mistakes and different problems before they turn out to be considerable.
Conclusion
Monitoring and diagnosing JavaScript mistakes the usage of Azure Monitor and Application Insights provide precious insights into your software's health and user revel in. You can efficaciously pick out, hint, and rectify JavaScript issues through making use of Azure Monitor's study analytics and diagnostic equipment. A extra constant and dependable consumer enjoy will result from performance optimization on your software, for you to also decrease the frequency of JavaScript error.
Similar Reads
How to catch all JavaScript errors and send them to server ?
Today there are a large number of Web APIs available. One of which is GlobalEventHandlers, an OnErrorEventHandler to be called when the error is raised. The onerror property of the GlobalEventHandlers is an EventHandler that processes error events. This is great for catching exceptions that never oc
2 min read
How to throw an error when using a property of an object ?
In this article, we will try to understand how we may throw an error when using a property of an object with the help of certain theoretical explanations as well as coding examples in JavaScript. Let us first have a look over the below section which shows the syntax for creating an object having cer
4 min read
How to display error without alert box using JavaScript ?
JavaScript errors are displayed using alert boxes, which can interrupt user experience and feel outdated. But Now, there are many alternatives to alert boxes for displaying error messages in a more user-friendly way. This article covers different methods to display errors dynamically without using a
3 min read
JavaScript Errors Throw and Try to Catch
JavaScript uses throw to create custom errors and try...catch to handle them, preventing the program from crashing. The finally block ensures that code runs after error handling, regardless of success or failure.throw: Used to create custom errors and stop code execution.try...catch: Allows you to c
3 min read
How to create a global Promise Rejection Handler in JavaScript ?
In this article, we will try to understand firstly how we create a Rejected Promise, and later we will see how we may create a Global Promise Rejection Handler which will try to handle (somehow) that Rejected Promise created earlier in JavaScript. Let us first try to understand how we create a Promi
2 min read
How to Start Unit Testing to a JavaScript Code?
Unit testing is a crucial part of software development that helps ensure individual parts of the code work correctly. For JavaScript, unit testing can be especially valuable given the dynamic nature of the language. This guide will introduce you to the two popular approaches to unit testing in JavaS
3 min read
How to Catch JSON Parse Error in JavaScript ?
JSON (JavaScript Object Notation) is a popular data interchange format used extensively in web development for transmitting data between a server and a client. When working with JSON data in JavaScript, it's common to parse JSON strings into JavaScript objects using the JSON.parse() method. However,
1 min read
Throwing an Error "cannot read property style of null" in JavaScript
In this article, we will see how we may receive an error "cannot read property style of null" in JavaScript, along with understanding the cause to get this error with the help of an example, and thereafter we will try to understand how we may correct it with certain small changes in the code snippet
3 min read
How to find whether browser supports JavaScript or not ?
We will discuss how to find whether our Browser supports JavaScript or not. For this, we need to use the <noscript> tag, which defines an alternate text to be displayed to users who have disabled <script> tag in their Browsers. Since JavaScript is written inside <script> tag in HTM
2 min read
How to throw an error in an async generator function in JavaScript ?
In this article, we will try to understand how to throw an error in a synchronous (abbreviated as "async") generator function in JavaScript with the help of theoretical as well as coding examples. Let us first have a look into the following section which will show us the syntax for declaring an asyn
2 min read