How to Position Annotate Text in the Blank Area of Facet ggplot in R
Last Updated :
30 Sep, 2024
Facet plots in ggplot2 are a powerful way to display multiple plots based on different subsets of your data. However, annotating text within these plots can be challenging, especially when you want to place text in specific blank areas. This article will walk you through the process of positioning and annotating text in the blank areas of facet plots.
Prerequisites
Make sure you have the following packages installed:
library(ggplot2)
library(dplyr)
Now we will discuss step by step How to Position annotated text in the Blank Area of Facet ggplot in R Programming Language.
Step 1: Creating a Basic Facet Plot
Let’s start by creating a basic facet plot using the mtcars dataset.
R
# Load the dataset
data("mtcars")

# Create a basic facet plot with ggplot
p <- ggplot(mtcars, aes(x = wt, y = mpg)) +
  geom_point() +
  facet_wrap(~cyl) +  # Faceting by the number of cylinders
  labs(title = "Miles per Gallon vs Weight",
       x = "Weight (1000 lbs)",
       y = "Miles per Gallon (mpg)")
p
Output:
 Creating a Basic Facet Plot
Step 2: Adding Annotations to a Specific Facet
To annotate a specific facet, we use geom_text() or annotate() to place text. However, to target a specific facet, we'll make use of the data parameter within geom_text().
R
# Add an annotation to the facet where cyl == 6
p + geom_text(data = data.frame(wt = 4, mpg = 25, cyl = 6, label = "6 Cylinders"),
              aes(x = wt, y = mpg, label = label),
              color = "blue", size = 5, fontface = "bold")
Output:
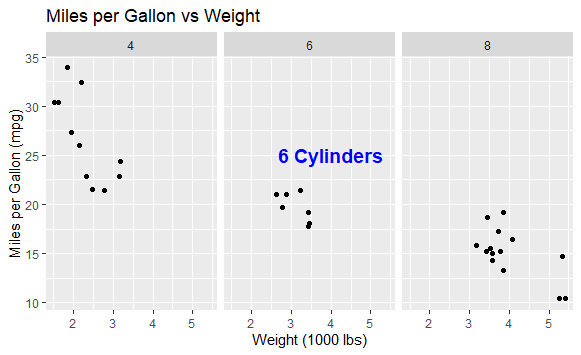 Adding Annotations to a Specific Facet
data: We create a small data frame to provide coordinates and facet values.wt = 4 and mpg = 25: Specify the x and y coordinates within the facet for cyl = 6.label = "6 Cylinders": The text we want to add.
Step 3: Positioning Annotations in Blank Areas
If you want to position text in areas outside the plot points, such as blank regions of your facet, you need to set x and y values beyond the data's range. This approach helps you place the annotation in the desired empty space.
R
# Adding text in the blank area (outside the range of data points)
p + geom_text(data = data.frame(wt = 6.5, mpg = 40, cyl = 4, label = "Cars"),
              aes(x = wt, y = mpg, label = label),
              color = "red", size = 4, fontface = "italic")
Output:
 Positioning Annotations in Blank Areas
wt = 6.5 and mpg = 40: These coordinates lie outside the range of the actual data points, allowing the text to be placed in the blank area of the facet for cyl = 4.
Step 4: Using Customized Coordinates for Precise Placement
You can customize your annotations by adding more detailed positions. Let's add annotations to all facets using a data frame.
R
# Create a data frame containing annotations for all facets
annotations <- data.frame(
  wt = c(6.5, 6.5, 6.5),
  mpg = c(40, 40, 40),
  cyl = c(4, 6, 8),
  label = c("Light Cars", "Medium Cars", "Heavy Cars")
)

# Add annotations using geom_text
p + geom_text(data = annotations, aes(x = wt, y = mpg, label = label),
              color = "darkgreen", size = 4, fontface = "italic")
Output:
 Using Customized Coordinates for Precise Placement
This code adds different annotations ("Light Cars", "Medium Cars", and "Heavy Cars") in the blank area of each facet for cyl = 4, 6, and 8.
Conclusion
Annotating text in blank areas of a facet plot can significantly enhance your data visualizations, making them more informative and easier to understand. By using geom_text() and annotate() functions in ggplot2, you can precisely place text annotations to convey additional insights.