How to perform T-tests in MS Excel?
Last Updated :
05 Dec, 2022
The T-Test function in Excel calculates the chance of a significant difference between two data sets, regardless of whether one or both are from the same population and have the same mean T-Test, which also includes whether the data sets we're utilizing for computation are a one-tail or two-tail distribution with a variance that might be equal or unequal.
Formula
=T.TEST(array1, array2, tails, type)
- Array1: This is the initial group of samples being tested.
- Array2: This is the second collection of samples being compared.
- Tails: The number of tails in a distribution. There are two kinds of tails (i.e the one-tailed distribution and the two-tailed distribution)
- Type: There are three types of T-Test Function which are discussed in the following:
- Paired: This checks to see if the mean of the paired sets is equal.
- Equal variances: The two-sample equal variance test determines if the variance of two sets of means is equal.
- Unequal variances: The two-sample uneven variance test determines if the variation of means between two groups is unequal.
Method 1: Using Formula
The functioning of the T.TEST is best demonstrated by utilizing an example dataset to obtain the T.TEST's logic.
I have classroom Test 1 and Test 2 test results. I need to run T.TEST to see whether there is a statistically significant difference between these two tests.
Sample Date:

Use T.TEST to determine the difference.
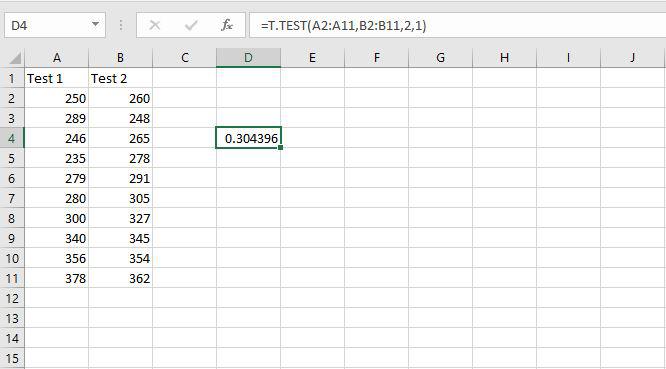
Example 1: Paired
The first test is a Paired two samples for a means test. In this example, we are calculating the Paired two samples for a means test using the T.TEST function taking a few arguments such as:
- In the first parameter select the cell from A2 to A11.
- In the second parameter select the cell from B2 to B11.
- The third parameter needs to determine how many tails the test has, it's always best to do a two-tailed test so that's why we are taking 2 there.
- In the fourth parameter, we take the value as 1 for calculating the Paired two samples for a mean test.

The following is the outcome:
Example 2: Equal variances
The second test is a Two sample assuming Equal variances test. In this example, we are calculating the Two samples assuming Equal variances test using the T.TEST function taking a few arguments such as:
- In the first parameter select the cell from A2 to A11.
- In the second parameter select the cell from B2 to B11.
- The third parameter needs to determine how many tails the test has, it's always best to do a two-tailed test so that's why we are taking 2 there.
- In the fourth parameter, we take the value as 2 for calculating the Two samples assuming the Equal variances test.

The following is the outcome:

Example 3: Unequal Variances
The third test is a Two-sample assuming an unequal variances test. In this example, we are calculating the Two-sample assuming an unequal variances test using the T.TEST function taking a few arguments such as:
- In the first parameter select the cell from A2 to A11.
- In the second parameter select the cell from B2 to B11.
- The third parameter needs to determine how many tails the test has, it's always best to do a two-tailed test so that's why we are taking 2 there.
- In the fourth parameter, we take the value as 3 for calculating the Two-sample assuming an unequal variances test.

The following is the outcome:

The returning result is referred to as the P-value.
Method 2: Use Analysis Tool Pack to run T.TEST
Follow the further steps to use analysis tool packets to run T.Test
Step 1: First, we'll enter each test's data in the way shown below:

Step 2: To begin, highlight all of the information, including the column headers:

Step 3: Then, select the Data tab from the top ribbon, followed by Data Analysis:

Step 4: Click t-Test: paired two Samples for means and then OK in the window that displays.

Step 5: Fill in the following fields, then click OK:

Step 6: It will display a comprehensive report.
This will provide the mean of each data set, its variance, the number of observations included, correlation, and P-value.
We need to look at the P-value, which is 0.02335799, which is much lower than the predicted P-value of 0.05.
Our data is significant as long as the P-value is less than 0.05.
Similar Reads
How to Perform Scheffe's Test in Excel? A post hoc test used in the Analysis of Variance is the Scheffe Test, which is also known as Scheffe's technique or Scheffe's approach. It carries Henry Scheffe's name, an American statistician. Scheffe's test is used to determine whether pairs of means are significant after you have done an ANOVA a
4 min read
How to Perform an ANCOVA Test in Excel? When a third variable (referred to as the covariate) is present that can be measured but not controlled and has a clear impact on the variable of interest, analysis of covariance (ANCOVA) is a technique used to compare data sets that contain two variables (treatment and effect, with the effect varia
4 min read
How to perform a Nested ANOVA Test in Excel? A nested ANOVA is a sort of ANOVA ("examination of fluctuation") in which something like one component is settled inside another element. For instance, assume a specialist needs to know whether three unique formulas of medicine produce various degrees of treatment. To test this, he has three unique
2 min read
How to Sort Subtotals in Excel Sorting and adding subtotals is one of the features of Excel which is important for organizing and summarizing data in a structured manner. In this article, you will see the overview of Sorting and Adding Subtotals to Excel and then will discuss all the steps to perform, allowing you to take control
4 min read
How to Perform an F-Test in Python In statistics, Many tests are used to compare the different samples or groups and draw conclusions about populations. These techniques are commonly known as Statistical Tests or hypothesis Tests. It focuses on analyzing the likelihood or probability of obtaining the observed data that they are rando
10 min read
How to Perform T-test for Multiple Groups in R A T-test is a statistical test used to determine whether there is a significant difference between the means of two groups. When dealing with multiple groups, the process becomes slightly more complex. In R, the T-test can be extended to handle multiple groups by using approaches like pairwise compa
4 min read