How to order boxes in boxplot with fct_reorder in R?
Last Updated :
27 Jan, 2022
In this article, we will discuss how to reorder boxes in boxplot with the fct_reorder() function in the R Programming Language.
By default, The ggplot2 boxplot orders the boxes in alphabetical order of categorical variable. But for better visualization of data sometimes we need to reorder them in sorted order. To sort the data in ascending or descending order, we use the fct_reorder() function of the forcats package. The forcats package of the R Language contains helpers for reordering and modifying factor levels. The fct_reorder() function helps us to reorder factor levels by sorting along with another variable.
Method 1: Reorder boxplot in ascending order
The fct_reorder() function by default sorts the data in the ascending order of value_variable. So, we use the fact_reorder() function to sort the data first in ascending order. Then we use the geom_boxplot() function of the ggplot2 package to plot the boxplot.
Syntax: df %>% mutate( categorical_variable= fct_reorder( categorical_variable, value_variable))
Parameters:
- df: determines the data frame to be used for reordering of data.
- categorical_variable: determines the variable which is to be reordered.
- value_variable: determines the variable according to which data is to be reordered.
Syntax to install and import tidyverse package:
install.package('tidyverse')    # To install
library(tidyverse)              # To import
Example:
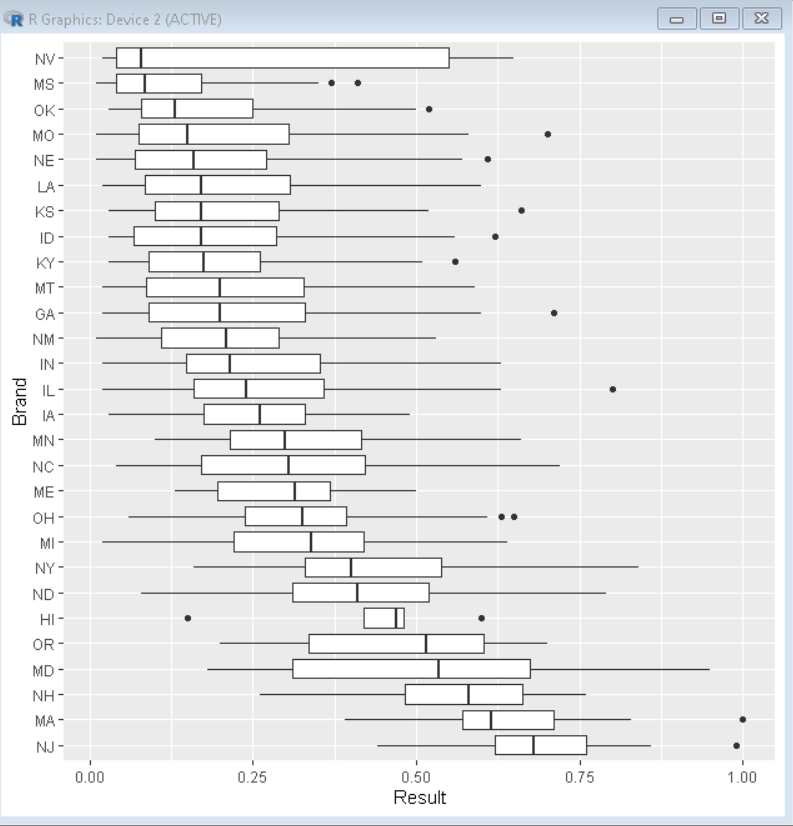
Here, is a basic boxplot with boxes sorted in ascending order. The CSV used in the example can be downloaded here.
R
# load library tidyverse
library(tidyverse)

# load sample data
sample_data <- read.csv("sample_box.CSV")

# Reorder data with fct_reorder function
# and plot boxplot
sample_data <- sample_data%>%mutate(Brand=fct_reorder(Brand, Result))

# plot boxplot
ggplot(sample_data, aes(x=Result, y=Brand))+
          geom_boxplot()
Output:

Method 2: Reorder boxplot in descending order
To reorder data in descending order, we use the .desc argument of the fct_reorder() function. The .desc argument when true, sorts the data in descending order, by default it is false thus giving data in ascending order.
Syntax: df %>% mutate( categorical_variable= fct_reorder( categorical_variable, value_variable, .desc))
Parameters:
- .desc: determines a boolean value, which if true sorts the data in descending order. By default, it is false.
Example:
Here, is a basic boxplot with boxes sorted in descending order.
R
# load library tidyverse
library(tidyverse)

# load sample data
sample_data <- read.csv("sample_box.CSV")

# Reorder data with fct_reorder function
# and plot boxplot
sample_data <- sample_data%>%mutate(Brand=fct_reorder(
  Brand, Result, .desc=TRUE))

# plot boxplot
ggplot(sample_data, aes(x=Result, y=Brand))+
          geom_boxplot()
Output:
Similar Reads
How To Reorder Boxplots in R with ggplot2? In this article, we will discuss how to reorder the boxplot with ggplot2 in R Programming Language. To reorder the boxplot we will use reorder() function of ggplot2. Syntax: ggplot(sample_data, aes(x=reorder(name,value),y=value)) By default, ggplot2 orders the groups in alphabetical order. But for b
2 min read
How to reorder barplots with facetting with ggplot2 in R? In this article, we will discuss how to reorder bar plots with facetting using the ggplot2 package in the R Programming Language. We can draw a facet bar plot by using the geom_col() function with the facet_wrap() function of the ggplot2 package. Syntax: ggplot( dataframe, aes( x, y ) ) + geom_col()
2 min read
How to Connect Data Points on Boxplot with Lines in R? In this article, we will discuss how to connect paired points in box plot in ggplot2 in R Programming Language. Boxplots with data points help us to visualize the summary information between distributions. For example, we may have two quantitative variables corresponding to two different categories
3 min read
How to Make Boxplot with a Line Connecting Mean Values in R? Box plots are a good way to summarize the shape of a distribution, showing its median, its mean, skewness, possible outliers, its spread, etc. These plots are the best method for data exploration. The box plot is the five-number summary, which includes the minimum, first quartile, median, third quar
2 min read
How to Reorder data.table Columns (Without Copying) in R In data analysis with R, the data.table package is a powerful tool for the handling large datasets efficiently. One common task when working with the data.table is reordering columns. This can be necessary for the better organization improved readability or preparing data for the specific analyses.
4 min read
How To Remove facet_wrap Title Box in ggplot2 in R ? In this article, we will discuss how facet_wrap works in R Programming Language. we will discuss all the types and methods. facet_wrap in RIn R Programming Language facet_wrap() is a function from the ggplot2 package that allows you to create multiple plots, or facets, based on a categorical variabl
4 min read