How to Make a Column Chart in Google Sheets
Last Updated :
20 Dec, 2024
Column charts in Google Sheets are a powerful tool for presenting data trends and comparisons visually. This guide will provide you with a column chart tutorial to help you create, customize, and effectively use column charts to analyze your data. Whether you're looking to understand data visualization in Google Sheets or customize the appearance of your charts, this tutorial has everything you need to get started.
 How to Make a Column Chart in Google Sheets
What is a Column Chart
A column chart is a type of chart that uses vertical bars to display and compare values across different categories. Each bar (or column) represents a category, and the height of the column corresponds to the value of that category.
Key features of column charts:
- Vertical Bars: The bars are oriented vertically, with their height reflecting the value.
- X-Axis and Y-Axis: The x-axis lists the categories (e.g., months, products), while the y-axis shows the values (e.g., sales, scores).
- Easy Comparison: The clear layout makes it simple to compare data across multiple categories.
Column charts are ideal for visualizing trends, comparisons, or patterns over time, such as tracking monthly revenue, student grades, or survey results. They are widely used in presentations and reports because of their clarity and simplicity.
How to Make a Column Chart in Google Sheets
Creating a Google Sheets column chart is easy. Follow these steps:
Step 1: Open Google Sheets
Before creating a chart, ensure your data is well-organized. Open Google Sheets and either create a new sheet or use an existing one.
 Open Google Sheets
 Step 2: Input Your Data
Enter your data into columns, ensuring each column has a clear header.
For example:
- Column A: Categories (e.g., months, products).
- Column B: Values (e.g., sales figures).
 Input Your Data
Step 3: Select the Data
Highlight the data by clicking and drag to select columns A and B or select range you want to include in your chart. Ensure you include the headers if you want them to appear in your chart.
 Select the Data
Step 4: Go to Insert Option
Click on the Insert menu in the top toolbar. From the dropdown, select Chart.
 Insert the Chart
Step 5: Insert the chart
After clicking the the chart, a default chart will appear on your sheet.
 Default chart
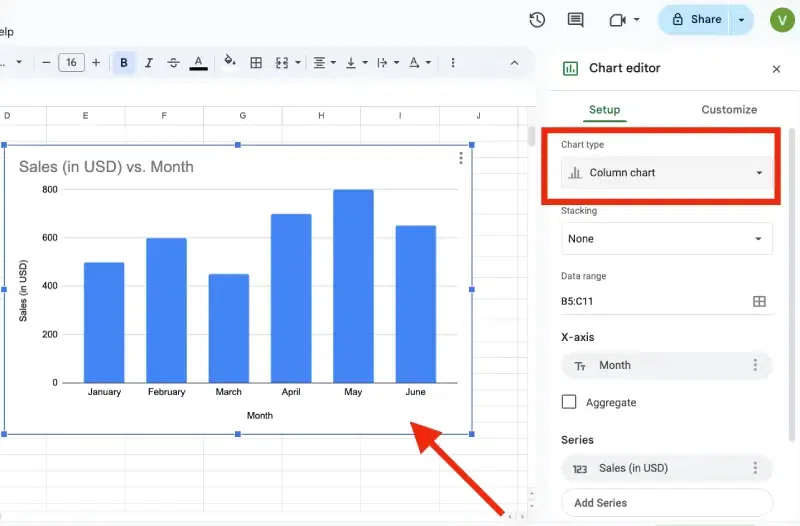
 Step 6: Change the Chart Type to Column
In the Chart Editor panel that appears on the right side:
- Navigate to the Setup tab.
- Under Chart type, select Column chart from the dropdown menu.
The chart will update to a column chart format.
 Change the Chart Type to Column
Step 7: Customize the Chart
To make your chart visually appealing and tailored to your needs. Go to the Customize tab in the Chart Editor.
Modify these key features:
- Chart Title: Add or edit the title under Chart & axis titles.
- Colors and Styles: Adjust bar colors under Series.
- Axis Labels: Edit axis names for clarity.
- Gridlines: Add or remove gridlines for better readability.
 Customize the Chart
Step 8: Position and Resize the Chart
- Click and drag the chart to reposition it on your sheet.
- Adjust the size by clicking and dragging the corners of the chart.
Step 9: Save and Share
To save your chart, Right-click on the chart and select Save image to download it. Alternatively, copy and paste it into a document or presentation. Share your Google Sheet by clicking the Share button in the top-right corner and configuring permissions as needed.
Tips for Creating Effective Column Charts
- Keep It Simple: Avoid adding too much data that makes the chart cluttered.
- Highlight Key Points: Use contrasting colors to emphasize critical data.
- Check Data Accuracy: Ensure your data is correctly formatted and up-to-date before creating the chart.
Conclusion
Mastering column charts in Google Sheets is essential for anyone aiming to simplify complex data presentations. By using this guide, you'll not only learn how to create and customize charts but also explore the benefits of analyzing data using column charts. Turn your raw numbers into insightful visuals and elevate your data visualization in Google Sheets for better decision-making.
Similar Reads
How to Make Bar Charts in Google Sheets
Bar charts are an excellent way to visually represent data comparisons, and Google Sheets offers intuitive tools to create and customize them. Whether you're looking to create a bar graph in Google Sheets or explore options like grouped and stacked bar charts, this guide will walk you through the st
5 min read
How to Make a Line Chart in Google Sheets
Visualizing data trends over time is made easier with line charts, and Google Sheets provides a simple yet effective way to create them. Whether you're tracking performance, analyzing trends, or presenting time-series data, learning how to make a line chart in Google Sheets can help convey your insi
4 min read
How to Make a Chart in Google Docs
Creating a chart in Google Docs is an easy process that enhances your documents with clear, visual data representations. This article will provide step-by-step instructions on how to insert and customize charts in Google Docs, helping you present your information in an engaging and easily understand
6 min read
How to Change Chart Colors in Google Sheets
Visualizing your data with charts in Google Sheets is an effective way to communicate information clearly. However, by default, the colors of the chart might not always align with your preferred aesthetic or data categorization. Changing the colors of your charts in Google Sheets can not only improv
6 min read
How to Make a Column Chart in Excel
Column Charts provide advanced options that are not available with some other chart types such as trendlines and adding a secondary axis. This tutorial will walk you through the step-by-step process of creating a column chart in Microsoft Excel. Column charts are used for making comparisons over tim
7 min read
How to Create and Customize Pie Charts in Google Sheets
Pie charts are a powerful tool for visualizing data, offering a straightforward way to understand proportions and percentages at a glance. Perfect for breaking down categories in a dataset, they transform complex information into clear visuals. Google Sheets provides easy-to-use features to make a p
8 min read
How to Add Error Bars in Google Sheets
Google Sheets is the popular online spreadsheet editor from the house of Google. It provides a simple, decluttered interface and a wide range of features. Also, you can easily create charts and graphs in Google Sheets from the entered data. In Google Sheets, adding error bars to your charts can sign
8 min read
How to Insert Multiple Columns in Google Sheets
Mastering Google Sheets is more than just knowing how to enter data – it's about making your spreadsheets work for you! Whether you’re managing a project, analyzing data, or collaborating with a team, knowing how to efficiently insert multiple columns in Google Sheets can save you time and keep your
9 min read
How to Create Charts or Graph in Google Sheets
Google Sheets is a powerful tool for organizing and analyzing data. Creating charts and graphs in Google Sheets allows you to convey information more effectively, whether you’re tracking sales, monitoring trends, or presenting data to others. In this article, explore the steps to create various type
6 min read
How to Add Title to a Chart in Google Sheets
If you've ever worked with charts in Google Sheets, you know that a title can make a big difference. Adding a title not only helps clarify what the chart represents, but it also enhances the overall presentation of your data. Without a title, your chart might leave people guessing about its purpose.
5 min read