How to Create Subplots in Seaborn?
Last Updated :
16 May, 2025
Subplots are multiple individual plots arranged within a single figure which are organized in rows and columns. It allow us to display different visualizations side by side, saving space and improving clarity. It also support shared axes for consistent scaling which makes it easier to identify patterns and create concise, professional presentations.
Subplots are useful because they:
- Enable quick comparison between different datasets in one view
- Provide a structured layout for multiple visualizations
- Reduce the need for multiple separate figures or windows
- Improve interpretation by grouping related charts
- Support complex analysis through combined visual contexts
In this article, we’ll see how to create and customize subplots to display several charts together clearly and effectively.
Lets see a example of basic single subplot
Python
import matplotlib.pyplot as plt
import numpy as np

fig, ax = plt.subplots()
x = np.linspace(0, 10, 100)
y = np.sin(x)
ax.plot(x, y)
ax.set_title('Single subplot')
plt.show()
Output:
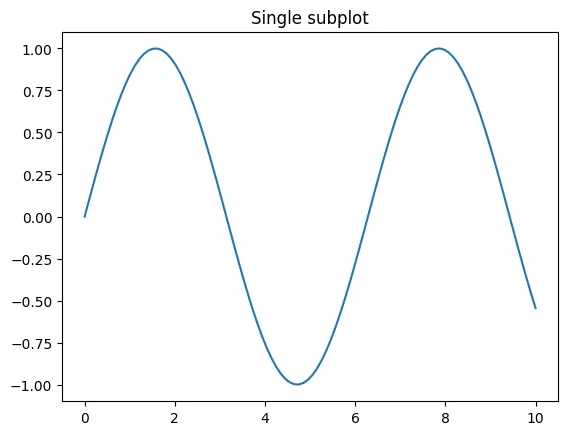 Single subplot
Syntax:
fig, axes = plt.subplots(nrows=1, ncols=1, sharex=False, sharey=False, figsize=None, dpi=None, squeeze=True, subplot_kw=None, gridspec_kw=None, **fig_kw)
Parameters:
- nrows (int): Number of rows of subplots in the figure by default it is 1.
- ncols (int): Number of columns of subplots in the figure default it is 1.
- figsize (tuple): Size of the entire figure in inches (width, height) which controls overall plot size.
- sharex (bool or str): If True or 'all' then subplots share the same x-axis scale for easy comparison.
- sharey (bool or str): If True or 'all' then subplots share the same y-axis scale.
- squeeze (bool): If True (default) reduces the returned axes array to the smallest possible shape like returns single Axes if only one subplot
Returns:
- fig: Figure object containing all subplots.
- axes: A single Axes object if one subplot otherwise an array of Axes objects for multiple subplots.
Different Subplots in Seaborn
We will be using Matplotlib and Seaborn libraries for creating subplots.
Example 1: Subplots with 1 row and 2 columns
We create a plot with 1 row and 2 columns. Since the arguments are given in order so specifying argument names is optional.
- figsize sets the overall figure size.
- sharex and sharey allow sharing the x-axis and or y-axis between the subplots.
Python
fig, axes = plt.subplots(1, 2, figsize=(10, 4), sharex=True)

axes[0].plot(x, np.sin(x))
axes[0].set_title('Plot 1')

axes[1].plot(x, np.cos(x))
axes[1].set_title('Plot 2')

plt.tight_layout()
plt.show()
Output:
 Subplots with 1 row and 2 columns
Example 2: Creating a grid of subplots with multiple levels
Create a larger grid with multiple rows and columns for displaying many plots.
Python
fig, axes = plt.subplots(3, 4, figsize=(15, 8), sharex='col', sharey='row')

for i, ax in enumerate(axes.flatten()):
    ax.plot(x, np.sin(x + i * 0.5))
    ax.set_title(f'Plot {i+1}')
    ax.label_outer()
plt.tight_layout()
plt.show()
Output:
 Subplots with multiple levels
Example 3: Using GridSpec for custom subplot layout
A GridSpec defines a grid with specified spacing between rows and columns. It does not create plots directly but provides an interface recognized by subplot() to place plots flexibly.
Python
import matplotlib.gridspec as gridspec

fig = plt.figure(figsize=(10, 6))
gs = gridspec.GridSpec(2, 3, width_ratios=[1, 2, 1], height_ratios=[1, 2], wspace=0.4, hspace=0.4)

ax1 = fig.add_subplot(gs[0, 0])
ax2 = fig.add_subplot(gs[0, 1:])
ax3 = fig.add_subplot(gs[1, :2])
ax4 = fig.add_subplot(gs[1, 2])

ax1.plot(x, np.sin(x))
ax1.set_title('Ax1')

ax2.plot(x, np.cos(x))
ax2.set_title('Ax2')

ax3.plot(x, np.tan(x/10))
ax3.set_title('Ax3')

ax4.plot(x, np.sinh(x/10))
ax4.set_title('Ax4')

plt.show()
Output:
 Using GridSpec
Example 4: 3×4 grid with shared axes per row and column
Here we create a 3×4 grid where all subplots in the same row share the y-axis and all subplots in the same column share the x-axis. This makes axis scales consistent across rows and columns.
Python
fig, axes = plt.subplots(3, 4, figsize=(15, 10), sharex='col', sharey='row')

for i, ax in enumerate(axes.flatten()):
    ax.plot(x, np.sin(x + i * 0.3))
    ax.set_title(f'Plot {i+1}')
    ax.label_outer()
plt.tight_layout()
plt.suptitle('3x4 Grid with Shared Axes', y=1.02)
plt.show()
Output:
 3×4 grid with shared axes
Mastering subplots allows us to create clear, organized and insightful visualizations that make data comparison easier and more effective.