How to Calculate the Midrange in Excel?
Last Updated :
30 Jul, 2021
MS Excel is a spreadsheet developed by the company Microsoft. Excel provides various kinds of functions and we can insert the data in form of rows and columns and perform operations on the data and yield the results we desired.
The Midrange of the dataset in other terms can be specified as average or mean. the Midrange is also known as the measure of center in statistics.
Midrange of any dataset can be calculated as follows: (largest value + smallest value) / 2
In order to calculate using formulas of excel we follow 3 steps:
- Calculate Min value
- Calculate Max value
- Apply midrange formula
Consider the following data i.e. marks obtained by students of a class
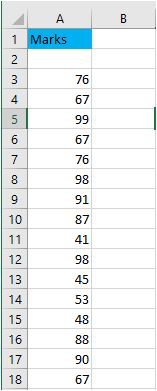 Sample data
To find the midrange of the given data we will follow the 3 steps
Step 1:Calculate the min value of the data by using the min function
 Min Value
Step 2:Calculate the max value of the data by using the max function
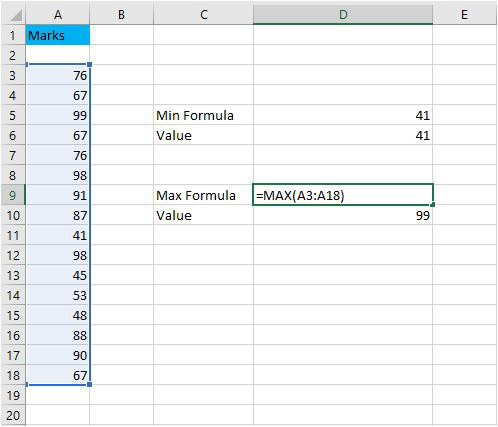 Max Value
Step 3:Now apply the midrange formula
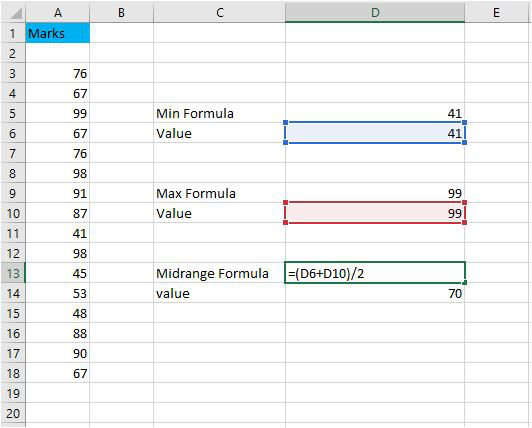 Midrange of the data
Finally, we get the midrange of the data as 70.
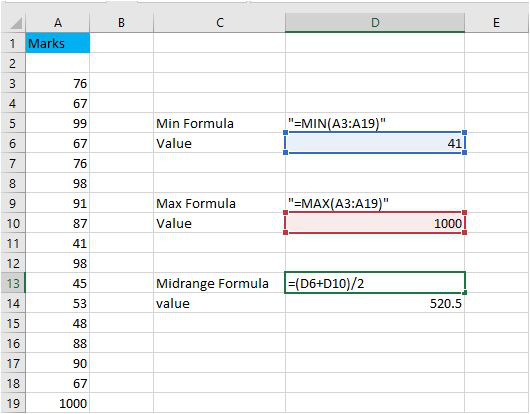
Drawbacks:
- The midrange deviates hugely when there are outliers in our data
- We need to find first the maximum and minimum value to the data in order to find the midrange
- The midrange sometimes differs from mean and median hugely.
For example in our data, consider another field with the value of 1000 then the midrange will be 520.5 which is far away from the original midrange of 70. So this shows how large the midrange deviates from the outliers.
Alternatives:
Instead of finding the midrange, we can directly calculate the mean, median of the data which points to the average or the midpoint of the data
Mean: It is the average value of the data set. It is calculated by the formula
Mean = Sum of all the observations/Total number of Observations
In excel we can directly compute the mean by using the average function.
Median: It is the middle value of the dataset. We need to first arrange the dataset in either non-increasing or non-decreasing order and select the middlemost element. In case there are two middlemost elements we compute the average of two.
In excel we can compute it by using the median function

This image gives the mean, median and midrange of the dataset.
Similar Reads
How to Calculate SMAPE in Excel? In statistics, we often use Forecasting Accuracy which denotes the closeness of a quantity to the actual value of that particular quantity. The actual value is also known as the true value. It basically denotes the degree of closeness or a verification process that is highly used by business profess
3 min read
How to Calculate the Interquartile Range in Excel? In statistics, the five-number summary is mostly used as it gives a rough idea about the dataset. It is basically a summary of the dataset describing some key features in statistics. The five key features are :Minimum value: It is the minimum value in the data set.First Quartile, Q1: It is also know
3 min read
How to Calculate Running Total in Excel? Excel is a tool widely used by professionals for financial data or trend analysis but can be used for different purposes. It is used for various data visualization purposes. It simplifies data management and data evaluation which uses spreadsheets for managing, storing, and visualizing large volumes
2 min read
How to Calculate Weighted MAPE in Excel? In statistics, we often use Forecasting Accuracy which denotes the closeness of a quantity to the actual value of that particular quantity. The actual value is also known as the true value. It basically denotes the degree of closeness or a verification process that is highly used by business profess
3 min read
How to Calculate Mean, Median and Mode in Excel Understanding the concepts of mean, median and mode in Excel can grow your mathematics and Excel skills. Understanding how to calculate mean in Excel, work out mean on Excel, how to calculate median in Excel, find median in Excel, and calculate mode in Excel can revolutionize how you interpret data.
9 min read
How to Calculate Mean Squared Error in Excel? Mean Squared Error is defined as the mean of the square of the difference between the actual values and the expected values.Where,O = Observed value,E = Expected Value,n = No. of observationsExample:Follow the below steps to evaluate the MSE in Excel:Step 1: Suppose we are given the data in form of
1 min read