How to add a grid on a figure in Matplotlib ?
Last Updated :
11 Jan, 2024
Matplotlib library is widely used for plotting graphs. In many graphs, we require to have a grid to improve readability. Grids are created by using grid() function in the Pyplot sublibrary. In this article, we will see how to add grid in Matplotlb.
Add a Grid on a Figure in Matplotlib
Below are the ways by which we can see how to add grid in Matplotlib in Python:
Add a Grid on a Figure in Matplotlib Using scatter()
In this example, the code uses the Matplotlib library to create a scatter plot of y = x^2 with points generated using NumPy. The first part uses the pyplot interface to create a scatter plot and grid on the y-axis. The second part creates a figure and axis explicitly, sets ticks on both the x and y axes, plots the scatter graph, and specifies the default grid on the figure.
Python3
import matplotlib.pyplot as plt
import numpy

# Define x and y
x = numpy.arange(0, 1, 0.1)
y = numpy.power(x, 2)

# Plot graph
plt.scatter(x, y)

# Define grid with axis='y'
plt.grid(axis='y')
plt.show()

# Define a figure
fig = plt.figure()
ax = fig.gca()

# Set labels on x and y axis of figure
ax.set_xticks(numpy.arange(0, 1, 0.1))
ax.set_yticks(numpy.arange(0, 1, 0.1))

# Plot the graph
ax.scatter(x, y)

# Specify default grid on figure
ax.grid()
ax.show()
Output:


Matplotlib Adding Grid Lines Using Plot()
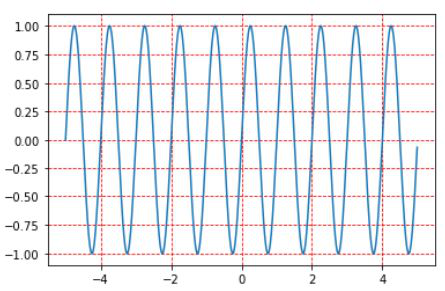
In this example, the given code uses the Matplotlib library to create a line graph of the sine function. It defines an array 'x' from -5 to 5 with a step size of 0.01 and calculates 'y' as the sine of 2π times 'x'. The code then plots the line graph, sets a red dashed grid, and displays the plot.
Python3
import matplotlib.pyplot as plt
import numpy as np

# Define x and y
x = np.arange(-5, 5, 0.01)
y = np.sin(2*np.pi*x)

# Plot line graph
plt.plot(x, y)

# Specify grid with line attributes
plt.grid(color='r', linestyle='--')

# Display the plot
plt.show()
Output:
Add a Matplotlib Grid on a Figure Using add_gridspec()
In this example, the code uses Matplotlib and add_gridspec() to create a figure with a 2x2 grid of subplots. It defines three subplots (line plot, scatter plot, and bar plot) within this grid and plots data on each. Additionally, it adds a dashed grid to all subplots, enhancing visualization. Finally, the `plt.show()` command displays the figure with the configured subplots.
Python3
import matplotlib.pyplot as plt
from matplotlib.gridspec import GridSpec

# Creating a grid of subplots
fig = plt.figure()

# Define a 2x2 grid
gs = GridSpec(2, 2)

# Creating subplots
ax1 = fig.add_subplot(gs[0, 0])
ax2 = fig.add_subplot(gs[0, 1])
ax3 = fig.add_subplot(gs[1, :])

# Plotting some data on the subplots
ax1.plot([1, 2, 3], [4, 5, 6])
ax2.scatter([1, 2, 3], [4, 5, 6])
ax3.bar([1, 2, 3], [4, 5, 6])

# Adding grid to all subplots
for ax in [ax1, ax2, ax3]:
    ax.grid(True, linestyle='--', linewidth=0.5, color='gray')

plt.show()
Output:
 Using add_gridspec For More Control
Similar Reads
How to Add Axes to a Figure in Matplotlib with Python? Matplotlib is a library in Python used to create figures and provide tools for customizing it. It allows plotting different types of data, geometrical figures. In this article, we will see how to add axes to a figure in matplotlib. We can add axes to a figure in matplotlib by passing a list argument
2 min read
Matplotlib.figure.Figure.add_subplot() in Python Matplotlib is a library in Python and it is numerical – mathematical extension for NumPy library. The figure module provides the top-level Artist, the Figure, which contains all the plot elements. This module is used to control the default spacing of the subplots and top level container for all plot
2 min read
Matplotlib.figure.Figure.add_gridspec() in Python Matplotlib is a library in Python and it is numerical – mathematical extension for NumPy library. The figure module provides the top-level Artist, the Figure, which contains all the plot elements. This module is used to control the default spacing of the subplots and top level container for all plot
2 min read
Matplotlib.figure.Figure.add_axes() in Python Matplotlib is a library in Python and it is a numerical – mathematical extension for NumPy library. The figure module provides the top-level Artist, the Figure, which contains all the plot elements. This module is used to control the default spacing of the subplots and top-level containers for all p
2 min read
Matplotlib.figure.Figure.set_canvas() in Python Matplotlib is a library in Python and it is numerical – mathematical extension for NumPy library. The figure module provides the top-level Artist, the Figure, which contains all the plot elements. This module is used to control the default spacing of the subplots and top level container for all plot
2 min read