Graph transformations involve changing the appearance or position of graphs by shifting them horizontally or vertically, stretching or compressing them, reflecting them across axes, or rotating them around a fixed point.
These modifications help visualize how functions change under different conditions or transformations.
Types of Graph Transformations
Transformations help us understand how the graph changes based on different factors, such as adding or subtracting numbers to the function, multiplying or dividing it, or reflecting it across an axis.
Translation
A graph can be translated in two ways, horizontally and vertically.
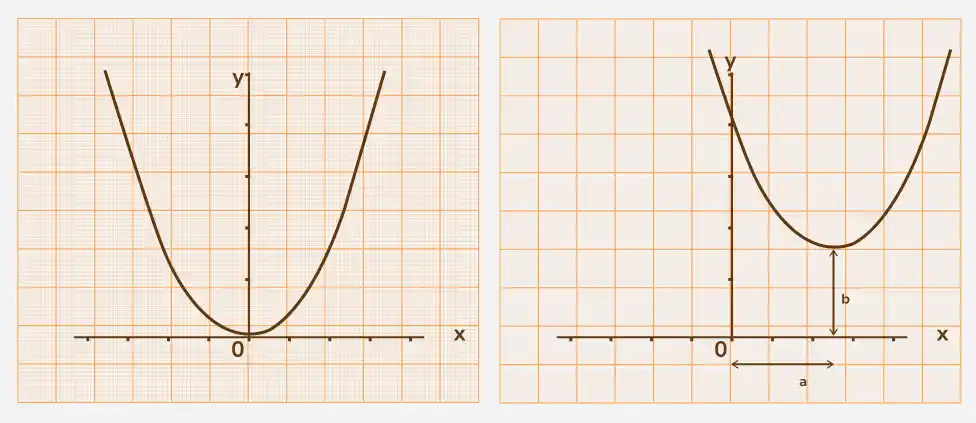
Horizontal Translation: When a graph is translated horizontally, each point on it moves left or right along the x-axis. The equation of the graph remains the same, but a constant value is added or subtracted from the x-coordinate of each point.
For example, if we translate the graph of y = f(x) by c units to the right, the new equation becomes y = f(x − c).
Vertical Translation: When a graph is translated vertically, each point on the graph moves up or down along the y-axis. The equation of the graph remains the same, but a constant value is added or subtracted from the y-coordinate of each point.
For example, if we translate the graph of y = f(x) by d units upward, the new equation becomes y = f(x) + d.
Reflection
Horizontal Reflection: A horizontal reflection, also known as a reflection across the y-axis, flips the graph of a function over the y-axis. This is achieved by replacing x with −x in the equation of the function. For example, if we reflect the graph of y=f(x) horizontally, the new equation becomes y=f(−x).
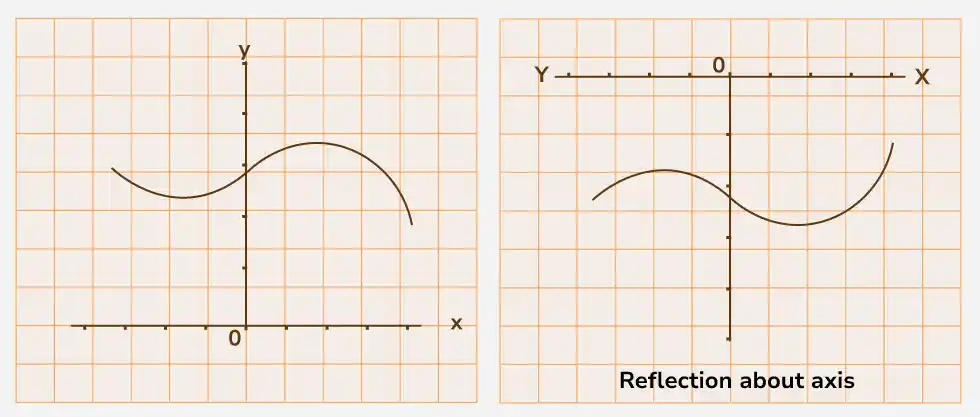
Vertical Reflection: A vertical reflection, also known as a reflection across the x-axis, flips the graph of a function over the x-axis. This is achieved by replacing y with −y in the equation of the function.
For example, if we reflect the graph of y=f(x) vertically, the new equation becomes y=−f(x).
Scaling (Dilation)
Scaling, also known as dilation, is a geometric transformation that involves stretching or compressing an object in one or more directions. In the context of graphs, scaling refers to the process of enlarging or shrinking a graph along the x-axis, y-axis, or both.
There are two types of scaling:
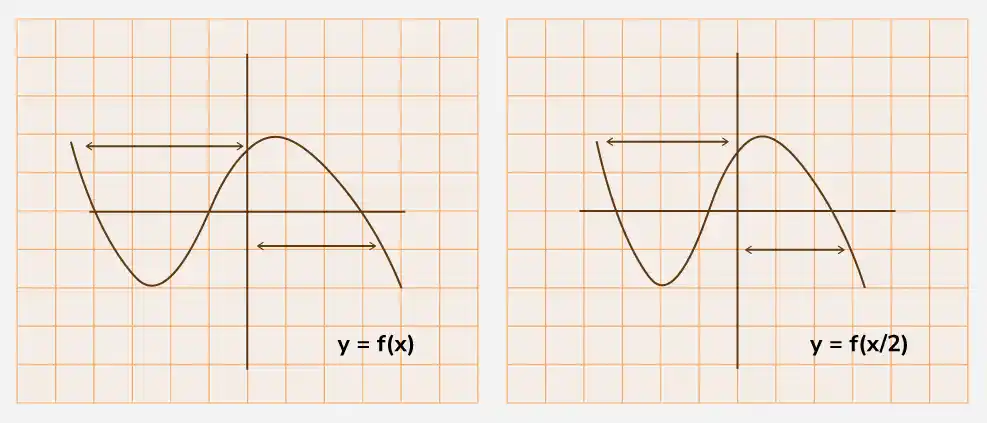
Horizontal Scaling: Horizontal scaling stretches or compresses the graph of a function horizontally. If the scaling factor is greater than 1, the graph is compressed, and if the scaling factor is between 0 and 1, the graph is stretched. This is achieved by changing the input of the function.
For example, if we scale the graph of y = f(x) horizontally by a factor of a, the new equation becomes:
y = f(ax)
- If a > 1 → graph is compressed horizontally
- If 0 < a < 1 → graph is stretched horizontally
Vertical Scaling: Vertical scaling stretches or compresses the graph of a function vertically. This is achieved by multiplying the output (y-values) of the function by the scaling factor.
For example, if we scale the graph of y = f(x) vertically by a factor of b, the new equation becomes:
y = b f(x)
- If b > 1 → graph is stretched vertically
- If 0 < b < 1 → graph is compressed vertically
Rotation
Clockwise Rotation: Clockwise rotation turns the graph of a function clockwise around a fixed point (usually the origin) by a certain angle. This is achieved by applying a rotation matrix to the coordinates of each point on the graph.
Example: If we rotate the graph of y = f(x) clockwise by an angle θ, the new coordinates (x', y') are obtained using the transformation:
(x', y') =
\begin{cases}x' = x \cos(\theta) + y \sin(\theta) \\y' = -x \sin(\theta) + y \cos(\theta)\end{cases}
Therefore, the new equation after rotating y = f(x) clockwise by θ is:
y = f \left( \frac{x \cos(\theta) + y \sin(\theta)}{\cos(\theta) - \sin(\theta)} \right)
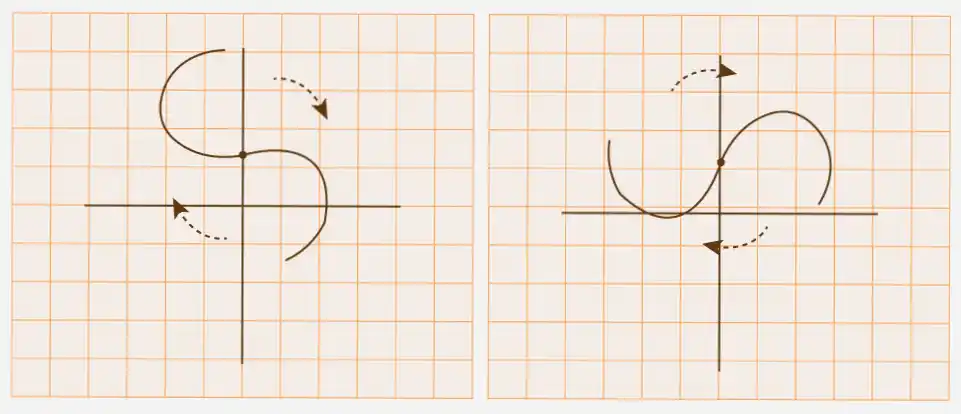
Counterclockwise Rotation: Counterclockwise rotation turns the graph of a function counterclockwise around a fixed point (usually the origin) by a certain angle. This is achieved by applying the inverse rotation matrix to the coordinates of each point on the graph.
Example: If we rotate the graph of y = f(x) anti-clockwise by an angle θ, the new coordinates (x', y') are obtained using the transformation:
(x', y') =
\begin{cases}x' = x \cos(\theta) - y \sin(\theta) \\y' = -x \sin(\theta) + y \cos(\theta)\end{cases}
Therefore, the new equation after rotating y = f(x) anti-clockwise by θ is:
y = f \left( \frac{x \cos(\theta) - y \sin(\theta)}{\cos(\theta) + \sin(\theta)} \right)
Shearing
Shearing is a geometric transformation that involves shifting one part of an object or figure in a fixed direction while keeping the rest of the object stationary. This results in a deformation of the object, where the shape is changed but the size and orientation remain the same.
In the context of graphs, shearing involves stretching or compressing a graph in one direction while leaving the other direction unchanged.
There are two types of shearing:
Horizontal Shearing
Horizontal shearing stretches or compresses the graph of a function horizontally in one direction while keeping the other direction unchanged. This is achieved by adding a multiple of the y-coordinate to the x-coordinate of each point on the graph.
Example: If we horizontally shear the graph of y = f(x) by a factor of k , the new coordinates (x', y') are obtained using the transformation:
(x', y') = \begin{cases}x' = x + ky \\y' = y\end{cases}
Therefore, the new equation after horizontally shearing y = f(x) by a factor of k is: y = f(x - ky)
Vertical Shearing
Vertical shearing stretches or compresses the graph of a function vertically in one direction while keeping the other direction unchanged. This is achieved by adding a multiple of the x-coordinate to the y-coordinate of each point on the graph.
Example: If we vertically shear the graph of y = f(x) by a factor of k , the new coordinates (x', y') are obtained using the transformation:
(x', y') = \begin{cases}x' = x \\y' = y + kx\end{cases}
Therefore, the new equation after vertical shearing y = f(x) by a factor of k is: y = f(x) - kx
Properties
Graph transformations exhibit several properties that are important to understand when manipulating graphs. Here are some key properties:
- Preservation of Shape: Most graph transformations preserve the basic shape of the original graph. For instance, a translation or rotation does not change the overall shape of the graph, but simply moves or rotates it.
- Preservation of Slope: Some transformations, such as translations and scalings, preserve the slope of the original graph. For example, if a function has a constant slope, it will maintain that slope after a translation or scaling.
- Preservation of Length: Certain transformations, like translations and rotations, preserve the lengths of line segments and curves on the graph. This means that distances between points on the original graph remain unchanged.
- Effect on Intercepts: Transformations can affect the intercepts of a graph. For example, a vertical translation will change the y-intercept of a function, while a horizontal translation will change the x-intercept.
- Symmetry: Some transformations introduce symmetry into the graph. For example, a reflection across the x-axis or y-axis creates symmetry with respect to that axis.
- Orientation: Transformations like rotations change the orientation of the graph. For example, a clockwise rotation will change the orientation of the graph compared to a counterclockwise rotation.
- Effect on Domain and Range: Certain transformations may affect the domain and range of the function represented by the graph. For example, a vertical scaling may stretch or compress the range of the function.
Solved Examples
Example 1: Horizontal Translation
Solution:
Original Function: f(x) = x2
Transformed Function: f(x - 3) = (x - 3)2
Result: The graph of f(x) = x2 is shifted 3 units to the right.
Example 2: Vertical Translation
Solution:
Original Function: f(x) = sin(x)
Transformed Function: f(x) + 2 = sin(x) + 2
Result: The graph of f(x) = sin(x) is shifted 2 units up.
Example 3: Reflection over the x-axis
Solution::
Original Function: f(x) = √(x)
Transformed Function: -f(x) = -√(x)
Result: The graph of f(x) = √(x) is reflected over the x-axis.
Example 4: Vertical Stretch
Solution:
Original Function: f(x) = cos(x)
Transformed Function: 2f(x) = 2cos(x)
Result: The graph of f(x) = cos(x) is stretched vertically by a factor of 2.
Example 5: Combination of Transformations
Solution:
Original Function: f(x) = x3
Transformed Function: 2f(3x - 1) + 4 = 2(3x - 1)3 + 4
Result: The graph undergoes a horizontal compression by a factor of 1/3, a horizontal translation by 1/3 units to the right, a vertical stretch by a factor of 2, and a vertical translation by 4 units up.