Getting Started with KNIME Analytics: Running the Platform
Last Updated :
23 Sep, 2024
Data Analytics is a process in which tools convert the raw data into meaningful format. For Structured Data, tools are required to handle the missing values, gain insights, convert to appropriate data formats, and generate charts so we can later use the data for further purposes.
 Knime Analytics
 Many Data Analytics tools are available out of which KNIME is most popular.
KNIME is a one stop Data Analytics platform in which we can import, clean, manipulate data with single clicks. It is no code platform as it makes use of nodes. Each node is a single entity that has some special functionality. The nodes are connected to one another. In KNIME, we simply import our data, choose nodes, get the output and later on export the workflow. Workflow is the region where we drag and drop the nodes. To get started with KNIME, the first step is installing the software on your machine.
You can refer to Download and Installation of KNIME Analytics Platform for understanding installation.
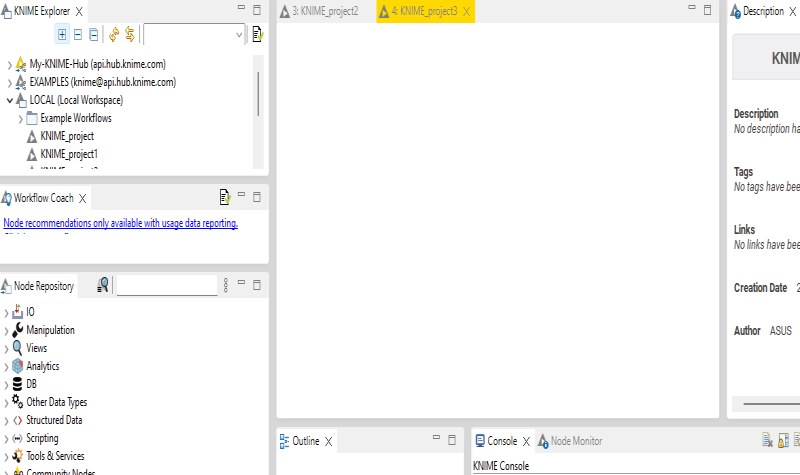
Navigating the User Interface of KNIME
After installing KNIME from the official website, a launcher dialog box will open in which we need to specify the directory in which the workspace is to be saved. There are two versions of KNIME UI: modern and classic. Now there are some parts that make up KNIME which are as follows:
- Explorer: In this section, we are able to see the workspaces that we have created and we can upload all the necessary files in that section.
- Node Repository: A node is the smallest unit that has some functionality. KNIME provides wide range of modes and the collection of the nodes are present in Node repository.
- Workspace: The empty space where we can drag and drop the nodes and create a workflow.
- Description: Here we can set the aim for our KNIME project. It has also other metadata features like Creation Date, Tags, links and author name.
 KNIME Analytics: Running the Platform
Creating a New KNIME Workflow
To create a new workflow follow the steps:
- Under the File option click on New option.
- There will be two options: Create KNIME Workflow and KNIME Workflow group. Click on the first option.
- A dialog box will pop up in which we have to specify the name and the workspace directory.
- Provide with the details and click OK. The Workflow Editor will open up.
1. Importing Data into KNIME
KNIME can deal with many data formats including CSV and Excel. Here we have used Netflix OTT Revenue and Subscribers (CSV File). Now we will use CSV Reader Node and double click on that node. Specify the file location and click on execute. In the bottom section we are able to see the table and also the statistics associated with it. The statistics includes column wise mean, quantile, missing values, unique values etc.
 KNIME Analytics: Running the Platform
2. Basic Data Manipulation - Data Preprocessing
We can perform basic data manipulation like filter, sort, perform mathematical operations , appending the outputs etc. After reading the data, we need to connect the Reader node with the Data Manipulation nodes.
This node is present in the Data Manipulation part. It is used to filter the column names, specify the patterns, wildcards etc. There are two sections: Include and Exclude. The columns can be filtered using the arrows. Here we have selected few columns to display our data.
 KNIME Analytics: Running the Platform
From the above output we can see that after executing the node, we can see the four columns as we have only selected four columns.
To sort our data in ascending or descending order, we can use Sorter node. Establish a connection between CSV Reader and Sorter. Double click on Sorter node. A dialog box will open. Select on which column the sorting is to be done and click on further advanced sorting options if required. Click on apply and execute.
 KNIME Analytics: Running the Platform
For instance using the Netflix data we have sorted Global Revenue in ascending order.
We can also perform mathematical operations on KNIME. We can create new columns by simply providing the mathematical operations. The best part of KNIME is that we do not have to remember the syntax of the Operation as it provides the formula n the Description part itself.
Double click on the Math Formula. A dialog box will open. In the left side column names are present and in the category all mathematical operations are present. Select on any one operation and the syntax will appear in the description part. Provide with the new column name and click on OK. Execute the node. Here we have calculate the sum of Global Revenue.
In KNIME we can group our columns and perform the aggregate operations like Mean, Median etc. Drag and drop the GroupBy node and establish connection with the imported data. Double click and select the grouping column. For Aggregate click on Manual Aggregation option, choose and click on OK. Execute the node to get the results.
From the below output we can see that we have calculated global revenue based on Date.
Handling missing values is an important step in Data Manipulation. We can also replace the missing values with any value or we can drop the rows as well. To handle the Missing Values, drag and drop the missing value node. Click on Configuration settings and choose what to do in case a missing vale exists. Then execute the node.
 KNIME Analytics: Running the Platform
Joiner node is used to join two or more tables based on a common column. It is similar to the SQL joins. We can specify what output to display whether the matched rows or left/right unmatched rows. The Joiner node needs two input tables.
As we can see here we have used the date column to join the tables. It returns the matching rows present in both the tables.
 KNIME Analytics: Running the Platform
Saving and Exporting Workflows in KNIME Analytics
KNIME provides the facility to save and export the workflows. For saving the workflows follow the steps:
1. For modern UI click on the Save button present in the left side.
 KNIME Analytics: Running the Platform
2. By default the local workspace is defined. Provide a name and click on OK.
The shortcut key to save the workflow is CTRL+S
Exporting Workflows
We can export our workflows as well on KNIME. Exporting means saving our workflows on our local system. The steps are as follows:
- Switch to the classical UI.
- Click on File.
- From the list of options click on Export KNIME Workflow.
- A dialog box will open. Specify the path where the workflow is to be saved and click on Finish. The workflow will be saved with .knwf extension.
 KNIME Analytics: Running the Platform
Conclusion
KNIME Analytics Platform is a versatile and powerful tool that simplifies data analytics through its drag-and-drop interface and wide range of built-in functionalities. From data preprocessing to machine learning, KNIME is a great platform for beginners and experts alike. By following the steps outlined in this article, you can start building your own workflows and exploring the vast possibilities of data analysis with KNIME.
Similar Reads
What is KNIME Analytics Platform? The KNIME Analytics Platform is an open-source software used for data analytics, reporting and integration. It provides a robust environment for data scientists, analysts and engineers to manipulate and analyze data, build machine learning models and visualize results. The KNIME's powerful workflow-
5 min read
How to use Azure Stream Analytics for stream processing Azure Stream Analytics is a managed stream processing engine for real-time data analysis from various sources, like devices and applications. It identifies patterns and triggers actions, making it useful for alerts, reporting, and data storage. It can run on Azure IoT Edge for processing data on IoT
9 min read
Top 11 Best Data Analytics Softwares That You Must Know Introducing you to the world of Data analysis! In today's fast-paced digital landscape, the demand for insightful data analysis has never been greater. Several data analytics tools are available on the market to assist with this process, each with unique features and functionalities. Whether you're
9 min read
Monitoring Kubernetes Clusters with Prometheus and Grafana In modern era of containers, Kubernetes has emerged as a leading band. like any robust system, effective assessment is critical to ensuring it works, reliably and is scalable. Prometheus and Grafana, two powerful tools, combine to provide robust solution for managing a Kubernetes clusters. This arti
8 min read
Working with Monitoring and Logging Services Pre-requisite: Google Cloud Platform Monitoring and Logging services are essential tools for any organization that wants to ensure the reliability, performance, and security of its systems. These services allow organizations to collect and analyze data about the health and behavior of their systems,
5 min read
Microsoft Azure - Using the Log Analytics Scope in Azure Monitor Pre-requisite: Azure VM Log Analytics is a service in the Azure portal to enable monitoring and capturing logs of resources in a database for monitoring and analyzing results. It is also used to manage the agent's configuration across azure services. In this article, you will learn about how you can
2 min read
Introduction to Monitoring using the ELK Stack ELK Stack is the top open-source IT log management solution for businesses seeking the benefits of centralized logging without the high cost of enterprise software. When Elasticsearch, Logstash, and Kibana are combined, they form an end-to-end stack (ELK Stack) and real-time data analytics platform
3 min read
Collect Metrics and Logs with the CloudWatch Agent Amazon CloudWatch is the powerful tool that used to collect metrics on resources and monitor their performance of the resources. It can monitor system-level metrics like CPU usage, memory usage, and disk space and also the application levels metrics like requests per second and error rates. By colle
4 min read
Top 15 Automation Tools for Data Analytics The exponential growth in data in recent times has made it imperative for organizations to leverage automation in their data analytics workflows. Data analytics helps uncover valuable insights from data that can drive critical business decisions. However, making sense of vast volumes of complex data
13 min read
What is a Data Science Platform? In the steadily advancing scene of data-driven navigation, associations are progressively going to refine apparatuses and advancements to bridle the force of data. One such essential component in data examination is the Data Science Platform. This article means to demystify the idea, investigate its
14 min read