How to Find Duplicates in Excel (2025 Step-by-Step Guide)
Last Updated :
23 Dec, 2024
Managing data effectively in Excel often requires identifying duplicate entries, which can clutter your analysis or lead to inaccuracies. Knowing how to find duplicates in Excel is essential for maintaining data integrity. From using COUNTIF to find duplicates to applying advanced filters and PivotTables, this guide covers step-by-step methods to locate duplicates and even identify unique values for improved data clarity.
 Find Duplicates in Excel
How to Identify Duplicates in Excel (4 Methods)
Are you looking for methods to find duplicate in Excel, below are the methods to search duplicates in excel spreadsheet:
Method 1: Finding Duplicates in Excel using Conditional Formatting
Excel Conditional Formatting Duplicates offers a fast and efficient way to visually identify duplicates in Excel. By highlighting duplicate values with colors, it simplifies spotting them within your dataset. This method allows you to identify duplicates without deleting them. Follow these easy steps to utilize this feature effectively.
Step 1: Open MS Excel and Enter the Data
Open MS Excel Spreadsheet and Enter Data into the Sheet. Before finding the duplicates, it's essential to ensure that the data is properly formatted and organized in Excel.
 Enter the Data
Step 2: Select the data
Highlight the cells in the column or table where duplicates might exist
 Select the Data
Step 3: Go to the Home tab and Select Conditional Formatting
Then, click on Home on the Ribbon. In the Styles group, click Conditional Formatting.
.webp) Go to Home Tab >> Click on "Conditional Formatting"
Go to Home Tab >> Click on "Conditional Formatting"
Step 4: In Conditional Formatting, Select Highlight Cells Rules and Choose Duplicate Values
In Conditional Formatting, select "Highlight Cells Rules" and then choose "Duplicate Values" to easily identify duplicates in your data.
You can also use the Conditional Formatting Keyboard Shortcut:
For Windows:
- Press Alt + H + L (Windows) to open the Conditional Formatting menu.
- Press D to select Highlight Cell Rules, then D again for Duplicate Values.
For Mac:
- Press Control + Option + Command + M to access the Conditional Formatting menu.
- Navigate to Highlight Cell Rules using the arrow keys or manually.
- Select Duplicate Values from the list.
.webp) Select "Highlight Cell Rules" >> Choose "Duplicates Values"
Select "Highlight Cell Rules" >> Choose "Duplicates Values" Step 5: Select Duplicate from the drop-down and Select Color
In the Duplicate Values box, select the formatting style which we want to apply to the duplicate values, and then click OK.
 Select Duplicates >> Select Color
Step 6: Preview Result
Duplicates will be highlighted immediately.
 Duplicates Highlighted
This method enables you to excel search duplicates and excel show duplicates in seconds, streamlining data management and ensuring data accuracy.
Note: Excel can't highlight duplicates in the Values area of a PivotTable report.
The COUNTIF function is a powerful and versatile tool in Excel that allows you to count occurrences of specific values in a dataset. By using COUNTIF to Find Duplicates, you can efficiently identify duplicate values in a column and categorize them as "Duplicate" or "Unique."
Step 1: Open MS Excel and Enter Data into the Sheet
Open Microsoft Excel and input your data into a new sheet, or open an existing Excel file where you need to identify duplicates.
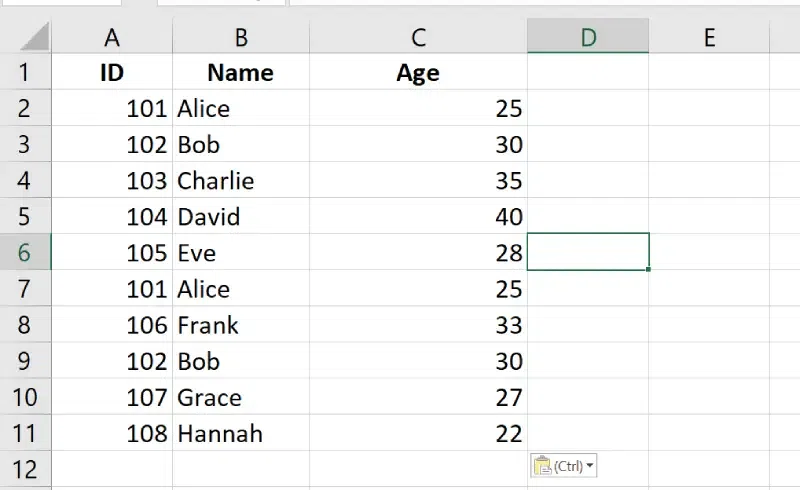 Enter Data into the Sheet
Step 2: Select a Column in which you want to Reflect Results
Select a Column next to your data. For example, if your data is in column A, insert a new column B. Label the column with something meaningful, like "Duplicate Check."
 New Column "Duplicate Check" Inserted
Step 3: Enter the COUNTIF Formula
Use the formula:
=IF(COUNTIF(A:A, A2)>1, "Duplicate", "Unique")
Replace A:A with your column range and A2 with the specific cell.
 Enter the COUNTIF Formula
Step 4: Drag Formula Down and Preview Results
Apply the formula to the entire column to identify duplicates and Preview the Results.
 Preview Result
Tips:
Combine this with filters to quickly review duplicates.
Method 3: Find Unique Values Using Advanced Filter In Excel
Advanced Filters in Excel are a practical tool for isolating unique or duplicate records, especially when you need to keep your original data intact. This method lets you extract filtered results to another location for further analysis, making it highly efficient for managing duplicates.
Step 1: Prepare your Data Set
Open MS Excel and Enter Data into the Sheet. Make Sure your Data should be Clean and Should contain Headers.
 Prepare your Dataset
Step 2: Go to the "Data" Tab and Select "Advanced" Option
Navigate to the Data tab on the Excel ribbon and Click on Advanced option in the Sort & Filter group.
 Go to Data tab>> Select Advanced Filters
Step 3: Configure the Advanced Filter
Once you click Advanced, a dialog box will appear with the following options:
Choose the Action
Filter the List, In-Place:
- Use this option if you want to display the filtered results directly within your current dataset.
Copy to Another Location:
- Choose this option to extract the filtered data to a separate location (preferred for duplicates extraction).
Specify the List Range
- In the List Range field, highlight the column or dataset you want to filter for duplicates.
- Ensure you include headers in the selection.
Set Criteria and Click OK
Check the box labeled Unique Records Only. This will ensure only unique values are extracted or displayed.
 Configure the Advanced Filter
 Step 4: Analyze Output
Excel will extract the unique records to the specified location.
 Preview Results
Note: This method is only useful when you need to keep unique records only.
Method 4: Find Duplicates with a PivotTable
Pivot Tables are a powerful feature in Excel that can help you identify and count duplicates efficiently. They summarize large datasets by organizing and aggregating data into a clear, structured format. Follow these steps to find duplicates using Pivot Tables:
Step 1: Prepare Your Dataset
Before creating a Pivot Table, ensure your dataset is clean.
 Prepare your Data
Step 2: Select the Data, Go to Insert Tab and Select Pivot Table
Highlight the column containing the data you want to analyze for duplicates. If your dataset contains multiple columns, select the entire dataset to maintain context. Go to Insert Tab and Select Pivot Table:
 Select the Data>> Go to Insert Icon >>Select Pivot Table
Step 3: Configure the Pivot Table
Once the Pivot Table is inserted, a blank table will appear along with the Pivot Table Fields pane.
Drag the Column into Rows
- Drag the column containing duplicate-prone data (e.g., "Data") into the Rows area.
- This will create a list of unique values from that column.
Drag the Same Column into Values
- Drag the same column into the Values area.
- By default, the Values area aggregates data using "Sum." Change this to "Count"
 Drag the Column to Rows and Values Filed
Step 4: Preview the Results
The Pivot Table will display a list of unique values in the Rows area.
- In the Values area, it will show the count of each value
- Any value with a count greater than 1 indicates duplicates.
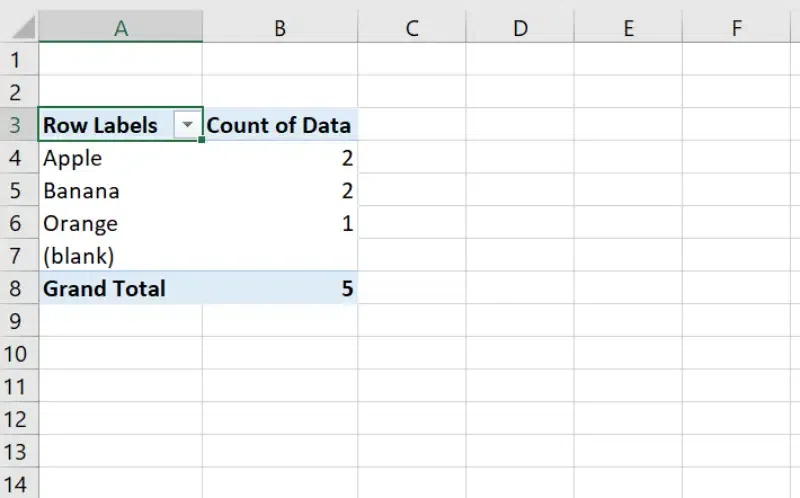 Preview the Results
Using Pivot Tables to find duplicates is a quick and efficient method for organizing and analyzing data. It not only identifies duplicates but also provides a count of how many times each value occurs, making it a versatile solution for data cleanup and reporting tasks.
Duplicates in Excel and Finding Unique Data - Advanced Methods
In addition to basic methods like Conditional Formatting and COUNTIF, here are some advanced techniques to search for duplicates in Excel:
Conclusion
Spotting duplicates in Excel is a vital skill for accurate data management and analysis. With techniques like Excel Duplicate Finder, COUNTIF to find duplicates, and leveraging filters or PivotTables, you can ensure your data remains clean and trustworthy. Use these methods to streamline your workflow and gain confidence in your results.
Similar Reads
How to Delete Filtered Rows in Excel: Step by Step Guide Efficiently managing data in Excel often involves filtering and removing unnecessary rows. However, deleting filtered rows in Excel can be tricky if not done correctly, as unwanted data may get removed. This article provides a step-by-step guide to help you safely and accurately delete filtered rows
9 min read
How to Find and Remove Duplicates in Excel Inacurate data always ruin your data and that the reason removing duplicates in Excel because it is one of the reason for duplicate data in Excel. In this guide, we aer going to explain you the best ways to find and remove duplicates in Excel. How to Find and Remove Duplicates in ExcelIn the section
9 min read
How to use Copilot in Excel with Examples (Step-by-Step Guide) As of 2025, Microsoft introduced a new feature called Copilot for Excel, part of the broader Microsoft 365 suite, designed to enhance productivity and streamline data manipulation using AI-powered tools. The introduction of Excel Copilot is transforming how professionals across industries manage and
9 min read
How to Use the UNIQUE Function in Excel: Step by Step Guide Do you struggle with manually removing duplicates in Excel? The UNIQUE function is here to make your life easier! In this article, you’ll learn how to quickly extract unique values from a list or range using the Excel UNIQUE function. Let’s get into the step-by-step process, formula examples, and ev
5 min read
How to Find Duplicate Values in Excel Using VLOOKUP? Excel is a great tool for working with data. One of its handy features is the VLOOKUP function, which helps you find matching or duplicate values in your data. In this article, we’ll show you how to use VLOOKUP to spot duplicates in a simple way. You’ll learn how to compare two columns in one sheet,
3 min read