In this article, we are going to filter the rows from dataframe in R programming language using Dplyr package.
Dataframe in use:

Method 1: Subset or filter a row using filter()
To filter or subset row we are going to use the filter() function.
Syntax:
filter(dataframe,condition)
Here, dataframe is the input dataframe, and condition is used to filter the data in the dataframe
Example: R program to filter the data frame
# load the package
library(dplyr)

# create the dataframe with three columns
# id , department and salary with 8 rows
data=data.frame(id=c(7058,7059,7060,7089,7072,7078,7093,7034),

                department=c('IT','sales','finance','IT','finance',
                             'sales','HR','HR'),

                salary=c(34500.00,560890.78,67000.78,25000.00,
                         78900.00,25000.00,45000.00,90000))

#display actual  dataframe
print(data)
print("==========================")

#filter dataframe with department is sales
print(filter(data,department=="sales"))
Output:

Method 2: Filter dataframe with multiple conditions
We are going to use the filter function to filter the rows. Here we have to specify the condition in the filter function.
Syntax:
filter(dataframe,condition1condition2,.condition n)
Here, dataframe is the input dataframe and conditions is used to filter the data in the dataframe
Example: R program to filter multiple rows
# load the package
library(dplyr)

# create the dataframe with three columns
# id , department and salary with 8 rows
data=data.frame(id=c(7058,7059,7060,7089,7072,7078,7093,7034),

                department=c('IT','sales','finance','IT','finance',
                             'sales','HR','HR'),

                salary=c(34500.00,560890.78,67000.78,25000.00,
                         78900.00,25000.00,45000.00,90000))

# display actual  dataframe
print(data)
print("==========================")

# filter dataframe with department is sales and
# salary is greater than 27000
print(filter(data,department=="sales" & salary >27000))
Output:

Example: Filter rows by OR operator
# load the package
library(dplyr)

# create the dataframe with three columns
# id , department and salary with 8 rows
data=data.frame(id=c(7058,7059,7060,7089,7072,7078,7093,7034),

                department=c('IT','sales','finance','IT','finance',
                             'sales','HR','HR'),

                salary=c(34500.00,560890.78,67000.78,25000.00,
                         78900.00,25000.00,45000.00,90000))

# display actual  dataframe
print(data)
print("==========================")

# filter dataframe with department is IT or salary
# is greater than 27000
print(filter(data,department=="IT" |  salary >27000))
Output:

Example: R program to filter using and, or
# load the package
library(dplyr)

# create the dataframe with three columns
# id , department and salary with 8 rows
data=data.frame(id=c(7058,7059,7060,7089,7072,7078,7093,7034),

                department=c('IT','sales','finance','IT','finance',
                             'sales','HR','HR'),

                salary=c(34500.00,560890.78,67000.78,25000.00,
                         78900.00,25000.00,45000.00,90000))

# display actual  dataframe
print(data)
print("==========================")

# filter dataframe with department is sales
# and salary is greater than 27000 or salary
# less than 5000
print(filter(data,department=="sales" & salary >27000 | salary<5000))
Output:

Method 3: Using slice_head() function
This function is used to get top n rows from the dataframe.
Syntax:
dataframe %>% slice_head(n)
where, dataframe is the input dataframe, %>% is the operator (pipe operator) that loads the dataframe and n is the number of rows to be displayed.
Example: R program that used slice_head() to filter rows
# load the package
library(dplyr)

# create the dataframe with three columns
# id , department and salary with 8 rows
data=data.frame(id=c(7058,7059,7060,7089,7072,7078,7093,7034),

                department=c('IT','sales','finance','IT','finance',
                             'sales','HR','HR'),

                salary=c(34500.00,560890.78,67000.78,25000.00,
                         78900.00,25000.00,45000.00,90000))

# display actual  dataframe
print(data)
print("==========================")

# display top 3 values with slice_head
data %>% slice_head(n=3)
print("==========================")

# display top 5 values with slice_head
data %>% slice_head(n=5)
print("==========================")

# display top 1 value  with slice_head
data %>% slice_head(n=1)
Output:

Method 4: Using slice_tail() function
This function is used to get last n rows from the dataframe
Syntax:
dataframe %>% slice_tail(n)
Where, dataframe is the input dataframe, %>% is the operator (pipe operator) that loads the dataframe and n is the number of rows to be displayed from last
Example: R program to filter last rows by using slice_tail() method
# load the package
library(dplyr)

# create the dataframe with three columns
# id , department and salary with 8 rows
data=data.frame(id=c(7058,7059,7060,7089,7072,7078,7093,7034),

                department=c('IT','sales','finance','IT','finance',
                             'sales','HR','HR'),

                salary=c(34500.00,560890.78,67000.78,25000.00,
                         78900.00,25000.00,45000.00,90000))

# display actual  dataframe
print(data)
print("==========================")

# display last 3 values with slice_tail
data %>% slice_tail(n=3)
print("==========================")


# display last 5 values with slice_tail
data %>% slice_tail(n=5)
print("==========================")

# display last 1 value  with slice_tail
data %>% slice_tail(n=1)
Output:

Method 5: Using top_n() function
This function is used to get top n rows.
Syntax:
data %>% top_n(n=5)
Example: R program that filter rows using top_n() function
# load the package
library(dplyr)

# create the dataframe with three columns
# id , department and salary with 8 rows
data=data.frame(id=c(7058,7059,7060,7089,7072,7078,7093,7034),

                department=c('IT','sales','finance','IT','finance',
                             'sales','HR','HR'),

                salary=c(34500.00,560890.78,67000.78,25000.00,78900.00,
                         25000.00,45000.00,90000))

# display actual  dataframe
print(data)
print("==========================")

# display last 3 values with top_n
data %>% top_n(n=3)
print("==========================")

# display last 5 values with top_n
data %>% top_n(n=5)
print("==========================")

# display last 1 value  with top_n
data %>% top_n(n=1)
Output:

Method 6: Using slice_sample() function
Here, we are going to filter rows using the slice_sample() function, this will return sample n rows randomly
Syntax:
slice_sample(n)
Example: R program to filter rows using slice_sample () function
# load the package
library(dplyr)

# create the dataframe with three columns
# id , department and salary with 8 rows
data=data.frame(id=c(7058,7059,7060,7089,7072,7078,7093,7034),

                department=c('IT','sales','finance','IT','finance',
                             'sales','HR','HR'),

                salary=c(34500.00,560890.78,67000.78,25000.00,
                         78900.00,25000.00,45000.00,90000))

# display actual  dataframe
print(data)
print("==========================")

# display last 3 values with slice_sample
data %>% slice_sample(n=3)
print("==========================")

# display last 5 values with slice_sample
data %>% slice_sample(n=5)
print("==========================")

# display last 1 value  with slice_sample
data %>% slice_sample(n=1)
Output:

Method 7: Using slice_max() function
This function returns the maximum n rows of the dataframe based on a column
Syntax:
dataframe %>% slice_max(column, n )
Where dataframe is the input dataframe, the column is the dataframe column where max rows are returned based on this column and n is the number of maximum rows to be returned
Example: R program to filter using slice_max() function
# load the package
library(dplyr)

# create the dataframe with three columns
# id , department and salary with 8 rows
data=data.frame(id=c(7058,7059,7060,7089,7072,7078,7093,7034),

                department=c('IT','sales','finance','IT','finance',
                             'sales','HR','HR'),

                salary=c(34500.00,560890.78,67000.78,25000.00,
                         78900.00,25000.00,45000.00,90000))

# display actual  dataframe
print(data)
print("==========================")

# return top 3 maximum rows based on salary
# column in the dataframe
print(data %>% slice_max(salary, n = 3))
print("==========================")

# return top 5 maximum rows based on department
# column in the dataframe
print(data %>% slice_max(department, n = 5))
print("==========================")
Output:

Method 8: Using slice_min() function
This function returns the minimum n rows of the dataframe based on a column
Syntax:
dataframe %>% slice_min(column, n )
Where dataframe is the input dataframe, the column is the dataframe column where max rows are returned based on this column and n is the number of minimum rows to be returned
Example: R program to filter using slice_min()
# load the package
library(dplyr)
# create the dataframe with three columns
# id , department and salary with 8 rows
data=data.frame(id=c(7058,7059,7060,7089,7072,7078,7093,7034),
department=c('IT','sales','finance','IT','finance',
'sales','HR','HR'),
salary=c(34500.00,560890.78,67000.78,25000.00,
78900.00,25000.00,45000.00,90000))
# display actual dataframe
print(data)
print("==========================")
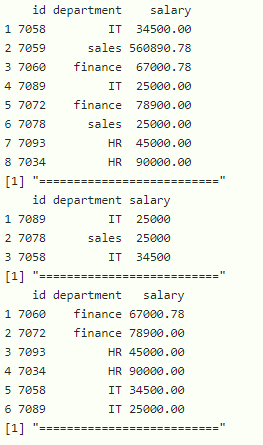
# return top 3 minimum rows based on salary
# column in the dataframe
print(data %>% slice_min(salary, n = 3))
print("==========================")
# return top 5 minimum rows based on department
# column in the dataframe
print(data %>% slice_min(department, n = 5))
print("==========================")
Output:
Method 9: Using sample_frac() function
The sample_frac() function selects a random n percentage of rows from a data frame (or table). First parameter contains the data frame name, the second parameter tells what percentage of rows to select
Syntax:
(sample_frac(dataframe,n)
Where dataframe is the input dataframe and n is the fraction value
Example: R program to filter data using sample_frac() function
# load the package
library(dplyr)

# create the dataframe with three columns
# id , department and salary with 8 rows
data=data.frame(id=c(7058,7059,7060,7089,7072,7078,7093,7034),

                department=c('IT','sales','finance','IT','finance',
                             'sales','HR','HR'),

                salary=c(34500.00,560890.78,67000.78,25000.00,
                         78900.00,25000.00,45000.00,90000))

# display actual  dataframe
print(data)
print("==========================")

# return 2 rows
print(sample_frac(data,0.2))
print("==========================")

# return 4 rows
print(sample_frac(data,0.4))
print("==========================")

# return 7 rows
print(sample_frac(data,0.7))
print("==========================")
Output:
