Exploring Data with Excel Power Pivot
Last Updated :
10 Oct, 2022
Power Pivot is an Excel one can use to perform intense information investigation and make modern information models. With Power Pivot, we can squash up enormous volumes of information from different sources, perform data examination quickly, and share experiences without any problem. In both Excel and in Power Pivot, you can make a Data Model, an assortment of tables with connections. The information model you find in an exercise manual in Excel is similar information model you find in the Power Pivot window. Any information you import into Excel is accessible in Power Pivot and the other way around.
Power Pivot - Exploring Data
We can get to the PowerPivot orders from the PowerPivot tab on the Ribbon. Click the PowerPivot tab on the Ribbon. The PowerPivot orders will be shown on the Ribbon. We can see that the orders connected with Data Model additionally show up here.

Loading Data from Access Database
To stack information from the Access data set, follow the given advances,
- Open one more clear activity manual in Excel.

- Click the PowerPivot tab on the Ribbon.

- Click Manage in the Data Model gathering.

- The Power Pivot window shows up.

- In the Power Pivot window, click the Home tab.

- Click From Database in the Get External Data bunch.

- Select From Database from the dropdown list.

- The Table Import Wizard shows up.

- Give a Friendly association name.
- Browse to the Access database file, Events.accdb, the Events database file.

- Click on the Next > button.
- The Table Import wizard tells decisions for picking the best way to import data.
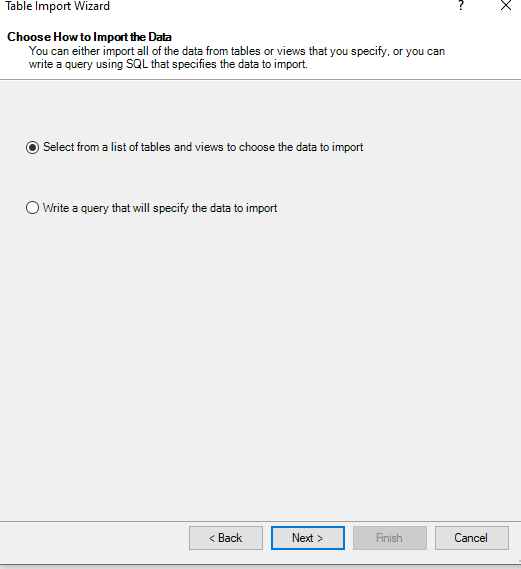
- Click Select from a list of tables and views to choose the data to import and snap Next. The Table Import wizard shows choices for picking how to import information.
- The Table Import Wizard shows every one of the tables in the Access data set you have chosen. Actually, look at every one of the cases to determine every one of the tables and snap Finish.

- The Table Import Wizard shows - Importing and shows the situation with the import. This might require a couple of moments, and you can stop the import by tapping the Stop Import button.
- When the information import is finished, Table Import Wizard shows - Success and shows the aftereffects of the import. Click Close.

- Power Pivot shows every one of the imported tables in various tabs in Data View.

- Click on the Diagram View.

- It will show the below format.

You can see that a relationship exists between the tables - Disciplines, and Medals. This is on the grounds that, when you import information from a social data set, for example, Access, the connections that exist in the data set likewise are imported to the Data Model in Power Pivot.
Creating a PivotTable from the Data Model
Make a PivotTable with the tables that you have imported in the past segment as follows,
- Click PivotTable on the Ribbon.

- Select PivotTable from the drop-down list.

- A void PivotTable is made in another worksheet in the Excel window.

- Every one of the imported tables that are a piece of Power Pivot Data Model shows up in the PivotTable Fields list.
- Drag the NOC_CountryRegion field in the Medals table to the COLUMNS region.

- Drag Discipline from the Disciplines table to the ROWS area.

- Filter Discipline to display only five sports: Archery, Cricket, Curling, Cycling Road, Cycling Track, and Eventing. This should be possible either in the PivotTable Fields region or from the Row Labels channel in the PivotTable itself.
- Select Medal from the Medals table again and drag it into the FILTERS area.

- Drag Medal from the Medals table to the VALUES region.

Exploring Data with PivotTable
You should show just those qualities with Medal Count > 2. To play out this, follow the given advances,
- Click the bolt to one side of Column Labels.

- Select Value Filters from the dropdown list.

- Select Greater Than from the second dropdown list. Click OK.

- The Value Filter exchange box shows up. Type 2 in the right-most box and snap OK.

- The PivotTable shows just those locales with an all-out number of awards of more than 2.

We could show up at the particular report that you needed from the various tables in only a couple of steps. This became conceivable in light of the previous connections among the tables in the Access data set. As we imported every one of the tables from the data set together simultaneously, Power Pivot reproduced the connections in its Data Model.
Summarizing Data from Different Sources in Power Pivot
In the event that we get the information tables from various sources or on the other hand, on the off chance that you don't import the tables from a data set simultaneously, or then again assuming that you make new Excel tables in your exercise manual and add them to the Data Model, you need to make the connections among your desired tables to use for your examination and synopsis in the PivotTable.
- Make another worksheet in the workbook.

- Add Sports table to Data Model.

- Make a connection between the tables Disciplines and Sports with the field SportID.

- Add the field Sport to the PivotTable.

- Mix the fields - Discipline and Sport in the ROWS region.

Extending Data Exploration
You can get the table Events additionally into additional information investigation. Make a connection between the tables-Events and Medals with the field DisciplineEvent.

Add a table Host to the workbook and Data Model.

Extending the Data Model using Calculated Columns
To interface the Hosts table to any of the different tables, it ought to have a field with values that extraordinarily recognize each column in the Hosts table. As no such field exists in the Host table, you can make a determined segment in the Hosts table, so it contains special qualities.
- Go to the Host table in the Data View of the PowerPivot window.

- Click the Design tab on the Ribbon. Click Add. The right-most segment with the header Add Column is featured.

- Type the accompanying DAX equation in the recipe bar = CONCATENATE ([Edition], [Season]). Press Enter.
Another segment is made with the header CalculatedColumn1, and the section is filled with the qualities coming about because of the above DAX recipe.

Right-click on the new section and select Rename Column from the dropdown list.

Type EditionID in the header of the new section. As may be obvious, the section EditionID has one-of-a-kind qualities in the Hosts table.

Creating a Relationship Using Calculated Columns
In the event that you need to make a connection between the Hosts table and the Medals table, the section EditionID ought to exist in the Medals table too. Make a determined section in the Medals table as follows,
- Click on the Medals table in the Data View of Power Pivot. Click the Design tab on the Ribbon. Click Add. Type the DAX equation in the recipe bar = YEAR ([EDITION]) and press Enter. Rename the new segment that is made as Year and snap Add.

- Type the accompanying DAX equation in the recipe bar = CONCATENATE ([Year], [Season]). Rename the new segment that is made as EditionID.

As you can notice, the EditionID segment in the Medals table has indistinguishable qualities from the EditionID section in the Hosts table. Subsequently, you can make a connection between the tables - Medals and Sports with the EditionID field.
- Change to the chart view in the PowerPivot window. Make a connection between the tables-Medals and Hosts with the field that is gotten from the determined segment, for example, EditionID. Presently you can add fields from the Hosts table to Power PivotTable.

Similar Reads
Loading Data with Power Pivot in Excel
There are two ways to input data into Power Pivot: Data may be immediately loaded into PowerPivot, populating the database, or it can be loaded into Excel and added to the Data Model. You may either create connections and/or use the existing connections to import data into the Power Pivot Data Model
5 min read
Exploring Data with Power View in Excel
Microsoft Excel's Power View is a complex visualization function that allows users to create graphs, charts, and reports. It makes it simple for organizations to create reports and dashboards that can be shared with stakeholders, managers, and other team members on a daily, weekly, and monthly basis
4 min read
Exploring Data with PivotTables in Excel
Broad information examination can be done utilizing PivotTables and produce wanted reports. The joining of the Data Model with PivotTable improves how the information is examined, associated, summed up, and detailed. You can import tables from outside information sources and make a PivotTable with t
4 min read
Exploring Data with Power View Maps in Excel
Maps in Power View present your data from a geographical perspective. Power View maps employ Bing map tiles, so you can zoom and pan just like any other Bing map. To make maps function, Power View must transfer data to Bing through a secure online connection for geocoding, which is why it prompts yo
3 min read
Excel Power Pivot - Managing Data Model
Power Pivot is something that helps us in relating between two different data sets which are in two different worksheets. We can manage and relate any type of data using Power Pivot. It is used for data analysis and creates many different data models. we can collect large data from different sheets
6 min read
Power Pivot for Excel
Power Pivot serves as an Excel add-on enabling robust data analysis and the creation of advanced data models. This tool facilitates the integration of extensive data from diverse sources, enabling swift information analysis and seamless sharing of insights. Whether working in Excel or Power Pivot, u
10 min read
Data Models in Excel Power View
The Data Model gives us the ability to work with multiple tables and integrate them with each other using a specified relationship to build a relational database inside Microsoft Excel. It helps to work with larger datasets and provides us with a huge set of interactive features for creating, modify
5 min read
How to Create a Power PivotTable in Excel?
When we have to compare the data (such as name/product/items, etc.) between any of the columns in excel then we can easily do with the help of Pivot table and pivot charts. But it fails when it comes to comparing those data which are in two different datasets, at that time Power Pivot comes into rol
4 min read
How to Flatten Data in Excel Pivot Table?
Flattening a pivot table in Excel can make data analysis and extraction much easier. In order to make the format more usable, it's possible to "flatten" the pivot table in Excel. To do this, click anyplace on the turn table to actuate the PivotTable Tools menu. Click Design, then Report Layout, and
7 min read
Analyzing Large Datasets With Power Pivot in Microsoft Excel
The setting for Power Pivot… If you are a successive Excel client, then you are most likely acquainted with turn tables. They are utilized for sorting out speedy bits of knowledge from modest quantities of information and can likewise be transformed into straightforward charts. In any case, even Exc
5 min read