Draw Composition of Plots Using the patchwork Package in R
Last Updated :
28 Jul, 2021
In this article, we will discuss how to draw a composition of plots using the patchwork package in R programming language. The patchwork package makes it easier to plot different ggplots in a single graph. We will require both ggplot2 packages for plotting our data and the patchwork package to combine the different ggplots.
Let us first draw all the plots normally and independently.
Example: Plotting the dataset in a bar plot
R
library(ggplot2)
library(patchwork)

data(iris)

head(iris)

# Plotting the bar chart
gfg1 <- ggplot(iris, aes(Sepal.Length, Petal.Length, color = Species)) +
geom_bar(stat = "identity")

gfg1
Output :
 Bar plot
Example: Plotting the dataset in a scatterplot
R
library(ggplot2)
library(patchwork)

data(iris)

head(iris)

# Scatterplot
gfg2 <- ggplot(iris, aes(Sepal.Length, Petal.Length,
                         color = Species)) + geom_point()

gfg2
Output :
 Scatterplot
Example: Plotting the dataset in a line plot
R
library(ggplot2)
library(patchwork)

data(iris)

head(iris)

# Line plot
gfg3 <- ggplot(iris, aes(Sepal.Length, Petal.Length,
                         color = Species)) + geom_line()

gfg3
Output :
 Line plot
Now let us look at how these three plots can be combined in various orientations.
Plotting Vertically
The vertical orientation combines the plots and these plots are placed side by side with each other. We will take the above ggplot2 plots and add them to arrange them vertically. The + operator is used to arrange these plots side by side in the same graph.
Example: Vertically arrange plots in the same frame
R
library(ggplot2)
library(patchwork)

data(iris)

head(iris)

gfg1 <- ggplot(iris, aes(Sepal.Length, Petal.Length,
                         color = Species)) + geom_bar(stat = "identity")

gfg2 <- ggplot(iris, aes(Sepal.Length, Petal.Length,
                         color = Species)) + geom_point()

gfg3 <- ggplot(iris, aes(Sepal.Length, Petal.Length,
                         color = Species)) + geom_line()

# Combination of plots by arranging them side by side
gfg_comb_1 <- gfg1 + gfg2 + gfg3

gfg_comb_1
Output :
 Vertical orientation
Arranging with different widths
The second combination of these plots would be arranging them in different widths in multiple rows and columns in the same graph window. The different width orientation arranges the plots in different lines according to widths. Basically, the first plot is placed on the first line and the other two plots are placed on the next line horizontally.
We use a slash(/) operator at that position where we want to start a new line. So we placed it after the first plot. Then, we use add(+) operator to arrange the other two plots horizontally on the next new line.
Example: Arranging plots with different widths
R
library(ggplot2)
library(patchwork)

data(iris)

head(iris)

gfg1 <- ggplot(iris, aes(Sepal.Length, Petal.Length,
                         color = Species)) +
geom_bar(stat = "identity")

gfg2 <- ggplot(iris, aes(Sepal.Length, Petal.Length,
                         color = Species)) +
geom_point()

gfg3 <- ggplot(iris, aes(Sepal.Length, Petal.Length,
                         color = Species)) +
geom_line()

# Arranging the plots in different widths
gfg_comb_2 <- gfg1 / (gfg2 + gfg3)

gfg_comb_2
Output :
 Different widths orientation
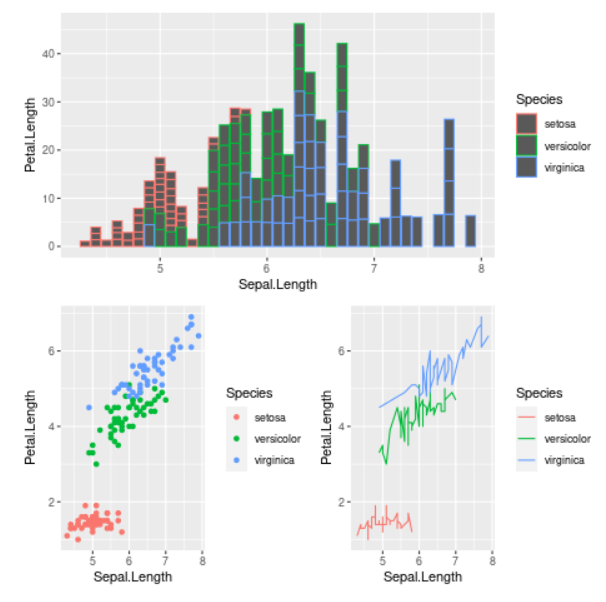
Arranging with different heights
The third combination of these plots would be arranging them in different heights in multiple rows and columns in the same graph window. The different height orientation arranges the plots in different lines according to heights. Basically, the first two plots are arranged horizontally and the last plot here is placed below the second plot.
We use the add(+) operator to arrange the first two plots horizontally. Then we use the slash (/) operator for the third plot to place it on a new line below the second plot.
Example: Arranging plots with different heights
R
library(ggplot2)
library(patchwork)

data(iris)

head(iris)

gfg1 <- ggplot(iris, aes(Sepal.Length, Petal.Length,
                         color = Species)) +
geom_bar(stat = "identity")

gfg2 <- ggplot(iris, aes(Sepal.Length, Petal.Length,
                         color = Species)) +
geom_point()

gfg3 <- ggplot(iris, aes(Sepal.Length, Petal.Length,
                         color = Species)) +
geom_line()

# Arrangement of plots according to
# different heights
gfg_comb_3 <- gfg1 + gfg2 / gfg3

gfg_comb_3
Output :
 Different heights orientation
Plotting Horizontally
The last combination of plots is to arrange them horizontally. These plots are placed one below the other. We will use the slash(/) operator to place these plots in a new line, one below the other plot.
Example: Arranging plots vertically
R
library(ggplot2)
library(patchwork)

data(iris)

head(iris)

gfg1 <- ggplot(iris, aes(Sepal.Length, Petal.Length, color = Species)) +
geom_bar(stat = "identity")

gfg2 <- ggplot(iris, aes(Sepal.Length, Petal.Length, color = Species)) +
geom_point()

gfg3 <- ggplot(iris, aes(Sepal.Length, Petal.Length, color = Species)) +
geom_line()

# Combination of plots by arranging them
# horizontally
gfg_comb_4 <- gfg1 / gfg2 / gfg3

gfg_comb_4
Output :
 Horizontal orientation
Similar Reads
Change Color Scheme of ggplot2 Plot Using ggthemr Package in R
The open-source tool ggplot2 in R is used for statistical data visualization. To make the plots made by ggplot2 more appealing and to apply colors, different designs, and styling ggthemr Package in R is a great help. ggthemr Package in R Programming Language is developed by Ciarán Tobin and maintain
4 min read
How to Combine Multiple ggplot2 Plots Use Patchwork
In this article, we are going to learn how to combine multiple ggplot2 plots using patchwork in the R programming language. ggplot2 is a popular data visualization package in R that is used to create complex and beautiful plots. However, sometimes we may want to combine multiple plots for comparison
5 min read
How to create 3D Plots and Animations in R using rgl Package
The R programming language provides a powerful set of tools and packages for creating interactive 3D plots and animations. One such package is RGL. In this article, let us learn How to create 3D plots and animations using the RGL package. Create 3D Plots and Animation in R using RGL Package The RGL
5 min read
Strip Plots Using Lattice Package in R
In general, Strip Plots are used to plot univariate data. It's a 2D plot where on X-Axis the response variables are plotted. These are alternatives to the histogram or density plot. It is typically used to plot small data sets so here we will be using the iris dataset to implement it. In, R Program
2 min read
Create a Choropleth Map by using Plotly Package in R
There are plenty of packages in R that can be used to make maps, like leaflet, mapview, ggplot, spplot, plotly, etc. Each of the packages has its own advantages and disadvantages. But all of them have the common goal of making it easy to create maps and visualize geospatial data. In this article, we
4 min read
How to create a scatter plot using lattice package in R?
In this article, we will discuss how to create the scatter plots using lattice package in R programming language. In R programming, the Lattice package is a data visualization library that consists of various functions to plot different kinds of plots. Using the lattice library we can able to plot v
2 min read
HexBin Plot using hexbin Packages in R
In this article, we are going to see how to plot HexBin Plot using R Programming Language. HexBin plot is also known as hexagonal bin plot and it looks like a honeycomb with different square shading. And each square shading notes with different data points graphed in two dimensions coordinated and
2 min read
How to create a boxplots using lattice package in R?
In this article, we will discuss how to create the boxplots using lattice package in R Programming language. In R programming, Lattice package is a data visualization library and consists of various functions to plot different kind of plots. Using lattice library we can able to plot different plots
2 min read
How to Create Pie Chart Using Plotly in R
The pie chart is a circular graphical representation of data that is divided into some slices based on the proportion of it present in the dataset. In R programming this pie chart can be drawn using Plot_ly() function which is present in the Plotly package. In this article, we are going to plot a pi
3 min read
How to label plot tick marks using ggvis in R
In this article, we will be looking at the approach to label tick marks using ggvis in the R programming language. The data frame is then subjected to the ggvis operations using the pipe operator. The ggvis method is used to start ggvis graphical window. The ggvis method has the following syntax :
3 min read