Distributed Tracing is a powerful monitoring technique that provides visibility into how requests flow through complex distributed systems, such as microservices architectures. By capturing and visualizing the journey of each request across multiple services, it helps developers and operators identify performance bottlenecks, latency issues, and system errors effectively.
- Tracks requests across multiple services to identify latency, errors, and performance issues in a distributed system.
- Helps in debugging and optimizing system performance by providing insights into bottlenecks and failures.
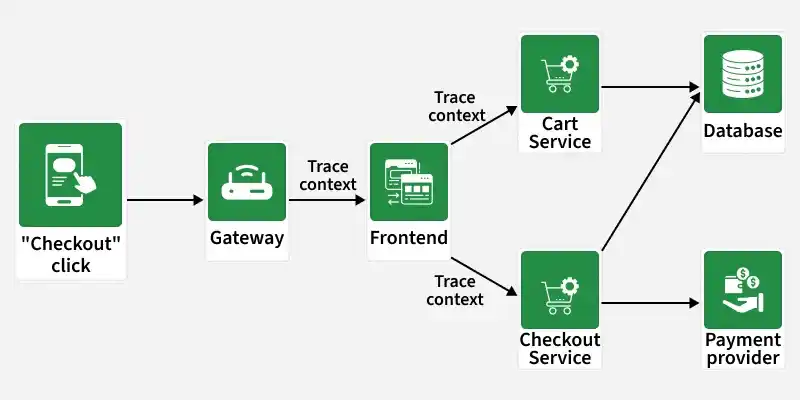
Example: In an e-commerce application, when a user places an order, distributed tracing follows an order request from the front-end to payment, inventory, and notification services. If there is a delay, it helps quickly find whether the issue is in payment or inventory processing.
Real-World Examples
The real-world examples of distributed tracing are:
- Uber: Uber uses Jaeger, an open-source tracing tool, to monitor how its microservices work together. It helps find slow services, track dependencies, and fix problems quickly, keeping the system fast and reliable.
- Netflix: Netflix uses distributed tracing to watch how requests move through its many microservices. This helps spot bottlenecks or errors so users can stream videos smoothly without interruptions.
- Airbnb: Airbnb uses tracing to see how different services interact and where delays occur. This helps them improve system stability and provide a smooth experience to users.
Characteristics
The characteristics of distributed tracing typically include the following key aspects:
- End-to-End Visibility: Distributed tracing provides a comprehensive view of the entire path a request takes through various services in a distributed system. This visibility includes tracing across service boundaries, allowing for a holistic understanding of request flow and dependencies.
- Trace Context Propagation: Trace context (such as trace and span IDs) is propagated across services, ensuring that all relevant components handling a request contribute to the same trace. This enables correlation of events and operations across distributed services.
- Granular Timing Information: Each span in a trace contains detailed timing information, capturing the duration of specific operations or actions within a service. This granularity helps in pinpointing performance bottlenecks and identifying latency issues.
- Metadata and Tags: Spans can include additional metadata and tags that provide context about the operation being traced. This information may include HTTP headers, user IDs, error codes, or any other relevant data that aids in understanding the behavior of the system.
- Sampling: Distributed tracing systems often employ sampling techniques to manage the volume of trace data generated, especially in high-throughput environments. Sampling decisions determine which traces and spans are collected and stored based on predefined criteria (e.g., probabilistic sampling, adaptive sampling).
Types
Distributed tracing helps teams monitor and analyze applications by tracking how requests flow and perform across systems. The main types include:
- Code Tracing: Tracks the flow of source code during a specific function to identify logical issues or errors.
Example: Verifying that a service request correctly queries the database and monitoring response times. - Program Tracing: Examines instruction addresses and memory variables during execution to detect deep performance issues.
Example: Diagnosing memory overflows, high resource usage, or blocked operations in an application. - End-to-End Tracing: Follows data as it moves across multiple services to understand transformations and dependencies.
Example: Tracking how a user request passes through authentication, inventory, and payment services in an e-commerce system.
Components
The key components of distributed tracing are:
- Instrumentation: The activity of introducing tracing code into applications and services to collect the tracing data. This can be, for example, done manually or by including properties for automatic instrumentation provided by tracing libraries.
- Trace Context Propagation: Some of the techniques used for extending the trace context across the service boundaries include but not limited to the HTTP headers or other protocols.
- Span Collection: It gathers spans from instrumented services and aggregates them into a trace.
- Trace Storage: Archiving of collected traces for analysis and visualization in a common database.
- Trace Analysis and Visualization: Systems for entering and manipulating trace data and displaying it to reveal characteristics of the executing system.
Working
Distributed tracing works by instrumenting applications to generate trace data as requests flow through different services in a distributed system. Below is how it typically operates:
- Instrumentation: Developers add code to their applications (often using libraries or SDKs) to create unique identifiers (usually called trace IDs and span IDs) for each request. These IDs allow tracing systems to correlate events across services.
- Propagation: As a request enters a service, the tracing context (containing trace and span IDs) is propagated. This ensures that subsequent services handling the request can continue to track its path.
- Span Creation: Each service creates spans, which represent specific operations or actions taken during the request’s lifecycle. Spans contain metadata such as timing information, tags, and logs.
- Data Collection: Collected span data (including IDs, timing information, and metadata) is sent to a centralized or distributed tracing backend. Examples of tracing backends include Jaeger, Zipkin, and AWS X-Ray.
- Visualization and Analysis: Tracing backends aggregate and store the collected data, allowing users to visualize the entire journey of a request across services. This visualization helps in identifying performance bottlenecks, latency issues, and dependencies between services.
- Root Cause Analysis: By examining trace data, developers and operators can trace back performance issues, errors, and other anomalies to specific services or operations within the distributed system.
Importance
Distributed tracing plays a crucial role in modern software architectures by providing visibility, improving performance, and helping quickly resolve issues across complex systems.
- End-to-End Visibility: Gives a complete view of a request’s journey across services, helping identify relationships, locate problems, and assess system status.
- Performance Monitoring: Quantifies latency for each service in the request path, helping teams pinpoint bottlenecks and optimize system performance.
- Error Diagnosis: Pinpoints the exact location of failures within the system, enabling faster root cause analysis and reducing downtime.
- Optimization: Provides insights to focus optimization efforts on services causing high latency, ensuring resources improve overall system efficiency.
Implementation Strategies
These approaches help enable effective distributed tracing and improve system observability.
- Manual Instrumentation: Applications require span creation and propagation to be done by developers through the addition of the tracing code.
- Automatic Instrumentation: Libraries and frameworks that help to automatically generate the code for establishing the trace.
- Sampling: Sampling of certain requests instead of keeping track of all the traces, striking a middle ground of providing good visibility without incurring much overhead.
- Distributed Context Propagation: W3C has developed various standards, including Trace Context that can be followed to have a standard way of transferring contexts from one service to another one.
- Centralized Trace Collection: Storing the traces in one location in order to query and analyze them conveniently.
Challenges
These factors can impact the effectiveness and performance of tracing systems.
- Overhead: Adding tracing can be over head to the system and hence it can affect the performance of the system.
- Data Volume: Having large amount of trace data can turnout to be a problem because it may be difficult to store as well as analyze.
- Context Propagation: Several challenges including but not limited, the following; maintaining steady propagation of trace context across services and technologies.
- Sampling Strategies: Capter 3 also covers the question of how to ensure that sufficient observability is achieved while keeping the performance cost of collecting trace data reasonable.
- Privacy and Security: Preventing the information that is totally irrelevant to the current step in the process from intruding into the trace data.
Distributed Tracing Tools
These tools help developers monitor complex distributed systems by tracking requests across services and improving performance visibility.
- Jaeger: An open-source, end-to-end distributed tracing tool which is originally created by Uber. It offers tools for trace collection, storage and analysis/visualization.
- Zipkin: An open-source distributed system for trace whose main function is to provide support in the collection of timing data required in…
- OpenTelemetry: A set of tools, APIs and SDK for attach trace, metrics data generation, log data collection and exporting for analysis.
- AWS X-Ray: A tool provided by Amazon Web Services, which is in charge of distributed tracing and diagnosis of program performance and dependencies.
- Datadog APM: An application performance monitoring tool with Distributed Tracing Functionality, that delivers holistic information about the operations of an application.