Dimensional data modeling is one of the data modeling techniques used in data warehouse design. The main goal of this modeling is to improve the data retrieval; it is optimized for SELECT OPERATION. The dimensional model is the data model used by many OLAP systems.
- Dimensional Data Modeling is used in data warehouses to organize data for easy analysis.
- Data is structured into Facts (numerical data) and Dimensions (descriptive information).
- It provides a simple and understandable structure for storing data and helps users analyze data easily for reporting.
Elements of Dimensional Data Model
Facts
Facts are the measurable data elements that represent the business metrics of interest. For example, in a sales data warehouse, the facts might include sales revenue, units sold, and profit margins. Each fact is associated with one or more dimensions, creating a relationship between the fact and the descriptive data.
Dimension
Dimensions are the descriptive data elements that are used to categorize or classify the data. For example, in a sales data warehouse, the dimensions might include product, customer, time, and location. Each dimension is made up of a set of attributes that describe the dimension. For example, the product dimension might include attributes such as product name, product category, and product price.
Attributes
Characteristics of dimension in data modeling are known as characteristics. These are used to filter, search facts, etc. For a dimension of location, attributes can be State, Country, Zipcode, etc.
Fact Table
In a dimensional data model, the fact table is the central table that contains the measures or metrics of interest, surrounded by the dimension tables that describe the attributes of the measures. The dimension tables are related to the fact table through foreign key relationships
Dimension Table
Dimensions of a fact are mentioned by the dimension table and they are basically joined by a foreign key. Dimension tables are simply de-normalized tables. The dimensions can be having one or more relationships.
Types of Dimensions in Data Warehouse Model
- Conformed Dimension: A dimension that is shared across multiple fact tables or data marts with the same structure and meaning.
- Outrigger Dimension: Dimension that is linked to another dimension rather than directly to a fact table.
- Shrunken Dimension: A subset of a larger dimension table containing only a few selected attributes.
- Role-Playing Dimension: Single physical dimension table that is used multiple times in a fact table for different roles (e.g., Ship date).
- Dimension to Dimension Table: Table that represents a relationship between two dimension tables, often used to resolve hierarchical or many-to-many relationships.
- Junk Dimension: A dimension created by combining multiple low-cardinality, unrelated attributes into a single table.
- Degenerate Dimension: Dimension key stored in the fact table without a corresponding dimension table (e.g., invoice number).
- Swappable Dimension: A dimension that can be easily replaced or altered without changing the fact table structure.
- Step Dimension: Dimension that represents the sequence or stage of a process or workflow.
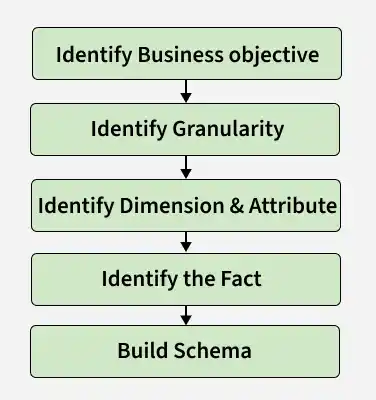
Steps to Create Dimensional Data Modeling
Step-1: Identifying the business objective: The first step is to identify the business objective. Sales, HR, Marketing, etc. are some examples of the need of the organization. Since it is the most important step of Data Modelling the selection of business objectives also depends on the quality of data available for that process.
Step-2: Identifying Granularity: Granularity is the lowest level of information stored in the table. The level of detail for business problems and its solution is described by Grain.
Step-3: Identifying Dimensions and their Attributes: Dimensions are objects or things. Dimensions categorize and describe data warehouse facts and measures in a way that supports meaningful answers to business questions. A data warehouse organizes descriptive attributes as columns in dimension tables. For Example, the data dimension may contain data like a year, month, and weekday.
Step-4: Identifying the Fact: The measurable data is held by the fact table. Most of the fact table rows are numerical values like price or cost per unit, etc.
Step-5: Building of Schema: We implement the Dimension Model in this step. A schema is a database structure. There are two popular schemes: Star Schema and Snowflake Schema.
Advantages
- Simplified Data Access: Dimensional data modeling enables users to easily access data through simple queries, reducing the time and effort required to retrieve and analyze data.
- Enhanced Query Performance: The simple structure of dimensional data modeling allows for faster query performance, particularly when compared to relational data models.
- Increased Flexibility: Dimensional data modeling allows for more flexible data analysis, as users can quickly and easily explore relationships between data.
- Improved Data Quality: Dimensional data modeling can improve data quality by reducing redundancy and inconsistencies in the data.
- Easy to Understand: Dimensional data modeling uses simple, intuitive structures that are easy to understand, even for non-technical users.
Disadvantages
- Limited Complexity: Dimensional data modeling may not be suitable for very complex data relationships, as it relies on simple structures to organize data.
- Limited Integration: Dimensional data modeling may not integrate well with other data models, particularly those that rely on normalization techniques.
- Limited Scalability: Dimensional data modeling may not be as scalable as other data modeling techniques, particularly for very large datasets.
- Limited History Tracking: Dimensional data modeling may not be able to track changes to historical data, as it typically focuses on current data.