Deploying a basic Streamlit app using Shiny package in R
Last Updated :
28 Apr, 2025
In this article, we will be discussing the steps to deploy a basic Streamlit app using the Shiny package in R. Streamlit is a Python library that allows you to build interactive web applications for machine learning and data science. Shiny is an R package that allows you to build interactive web applications for data science. By combining these two packages, we can build a powerful interactive web application for data science in R. This is particularly useful for data scientists and machine learning engineers who work with R and want to build interactive web applications for their models and data visualizations. In this article, we will go through the installation of the required packages, creating a new R script, building the UI, and server logic, and running the app. We will also provide some examples to demonstrate the usage of Streamlit and Shiny in real-world applications.
Example of Streamlit app using Shiny package in R
A basic understanding of the Streamlit and Shiny packages is necessary to understand how they are used to create interactive web applications and how they differ. This includes knowledge of the different functions and features provided by each package and how they are used to create user interfaces, handle user input, and display output.
- Installing Required Packages
- Creating the UI of the App
- Creating the Server Logic
- Running the App
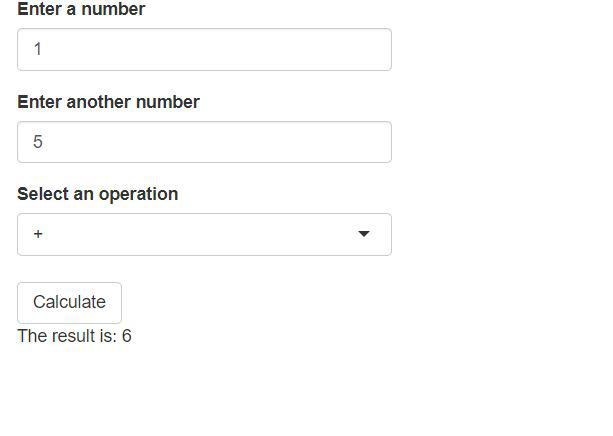
A Simple Calculator App
In this example, we create a Shiny app with a calculator. A simple calculator app interface that takes two numbers and operations from the user and on submission it displays the result.
R
library(streamlit)
library(shiny)

# UI
ui <- fluidPage(
  textInput("num1", "Enter a number"),
  textInput("num2", "Enter another number"),
  selectInput("operation", "Select an operation", c("+", "-", "*", "/")),
  actionButton("submit", "Calculate"),
  textOutput("result")
)

# Server Logic
server <- function(input, output) {
  observeEvent(input$submit, {
    num1 <- as.numeric(input$num1)
    num2 <- as.numeric(input$num2)
    operation <- input$operation
    if (operation == "+") {
      result <- num1 + num2
    } else if (operation == "-") {
      result <- num1 - num2
    } else if (operation == "*") {
      result <- num1 * num2
    } else {
      result <- num1 / num2
    }
    output$result <- renderText({
      paste0("The result is: ", result)
    })
  })
}
shinyApp(ui = ui, server = server)
Output:
Shiny App with a Plot
here, we create a Shiny app with a plot. The plot is created using the 'plot' function from the base R package and displayed on the app using the 'plotOutput' function. The plot displays the relationship between weight and miles per gallon for the cars in the 'mtcars' dataset.
R
library(shiny)

ui <- fluidPage(
  plotOutput("plot")
)

server <- function(input, output) {
  output$plot <- renderPlot({
    plot(mtcars$wt, mtcars$mpg, xlab = "Weight", ylab = "MPG",
         main = "Scatter Plot")
  })
}

shinyApp(ui = ui, server = server)
Output:

A Shiny App with a Table
In this example, we show how to create a Shiny app with a table. The table is created using the 'renderTable' function and displays the first six rows of the 'mtcars' dataset.
R
library(shiny)

ui <- fluidPage(
  tableOutput("table")
)

server <- function(input, output) {
  output$table <- renderTable({
    head(mtcars)
  })
}

shinyApp(ui = ui, server = server)
Output:

A Shiny App with Input and Output
Here, we create a Shiny app with both input and output. The app has a single text input, where the user can enter a text value. The entered text is then displayed on the app using the 'textOutput' function.
R
library(shiny)

ui <- fluidPage(
  textInput("text", "Text Input"),
  textOutput("output")
)

server <- function(input, output) {
  output$output <- renderText({
    paste("You entered:", input$text)
  })
}

shinyApp(ui = ui, server = server)
Output:

A Shiny App with Multiple Inputs and Outputs
In this example, we create a Shiny app with multiple inputs and outputs. The app has two sliders, one for the number of observations and one for the standard deviation. The app then generates a random normal distribution based on the user's inputs and displays the histogram and summary statistics of the generated data.
R
library(shiny)

ui <- fluidPage(
  titlePanel("Multiple Inputs and Outputs"),
  sidebarLayout(
    sidebarPanel(
      sliderInput("obs", "Number of Observations:", min = 1,
                  max = 100, value = 50),
      sliderInput("sd", "Standard Deviation:", min = 0,
                  max = 10, value = 2)
    ),
    mainPanel(
      plotOutput("distPlot"),
      verbatimTextOutput("summary")
    )
  )
)

server <- function(input, output) {
  data <- reactive({
    rnorm(input$obs, mean = 0, sd = input$sd)
  })

  output$distPlot <- renderPlot({
    hist(data(), main = "Histogram of Random Normal Distribution")
  })

  output$summary <- renderPrint({
    summary(data())
  })
}

shinyApp(ui, server)
Output:
