Creating Table Relationships and Data Models in Power BI
Last Updated :
02 May, 2025
Power BI Data Model is the collection of tables and relationships between them that are used to create reports and visualizations. It involves defining relationships between tables and creating calculated columns and measures. In this article, we will learn about data models in Power BI.
Model Relationships in Power BI
In Power BI model relationships define how the tables are linked. In model relationships you can create effective and insightful data visualization for easy understanding. There are different types of relationships:-
- One-to-One Relationships: Each row in the first table is connected to one and only one row in the second table.
- Many-to-One Relationships: Many rows in the first table are connected to one row in the second table.
- One-to-Many Relationships: Each row in the first table is connected to one or many rows in the second table.
- Many-to-Many Relationships: Each row in the first table can be connected to many rows in the second table. They are a type of relationship that requires an intermediate table that links the two main tables.
Always use unique and descriptive column names to avoid confusion in creating relationships and use a hierarchy of tables to manage relationships between multiple tables.
How to Create Relationship in Power BI?
Creating relationships in Power BI defines how tables are connected helping you to analyze and visualize data from multiple sources seamlessly. Power BI provides two methods for creating relationships: Autodetect and Manual.
- Autodetect method automatically identifies and creates relationships based on fields with matching names in different tables making the process quick and easy.
- If you prefer more control the Manual method allows you to specify which tables and fields to connect and define the relationship type such as One-to-One, One-to-Many, Many-to-One or Many-to-Many.
Below are some methods we can do in Power BI for Data Models Relationships.
1. Creating Relationship with Autodetect
By using auto-detect feature while creating a relationship users can establish relationships between tables based on field name and interconnected to data model for report and analyze. Steps-by-Steps guidelines are:
Step 1: Load your Data using the “Home” tab and select “Get Data”.
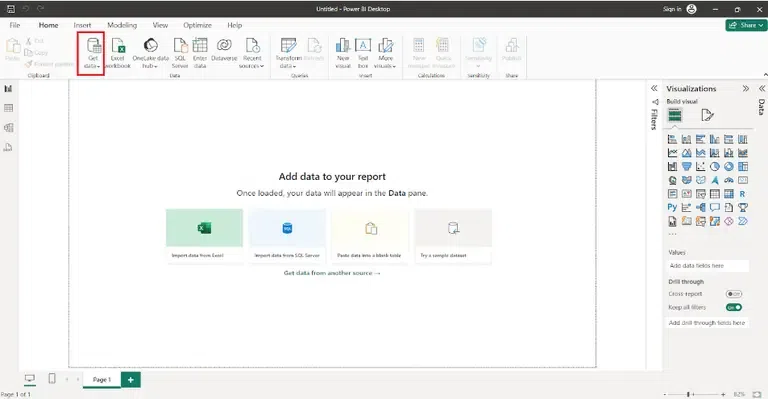 Get Data
Step 2: On the modeling view, Go to the “Manage Relationship”.
 Manage Relationship
Step 3: Select “Autodetect” option and then select the "OK" option
 Autodetect Relationship
2. Creating a Relationship Manually
In Power BI users can create table relationships manually. Cardinality and cross-filter direction are automatically set during creation but users can edit them as required. By manually creating relationships in Power BI users have greater control and are able to customize the relationships between two tables that are interconnected to each other. Steps-by-Steps guidelines are:
Step-1: Load your Data using the “Home” tab and select “Get Data”.
Get DataStep-2: On the modeling view, go to the “Manage Relationship”.
Manage RelationshipStep-3: Select “New” option and then select the first table and then select the column you want to use in a relationship then select the second table and then select the column you want to use in a relationship and select the “OK” option.
 Manual Relationship
3. Edit Relationships in Power BI
Table relationships in Power BI can be edited using different methods:
Diagram View
Open the "Diagram View". Drag and drop fields between related tables to establish or edit relationships and adjust cardinality and cross-filter direction as needed.
 Diagram View
Manage Relationships
To manage the relationship go to the Home tab and select "Manage Relationships". Select the existing relationship to edit or add a new one and specify tables, related fields and cardinality.
 Manage Relationship
Data View
Open "Data View." Click on the relationship icon next to the field to edit relationships and then modify related fields and cardinality as required.
 Data View in Power Bi
Once your tables are interconnected with each other it is very important to edit relationships in power bi. Editing relationship adjust the properties of an existing relationship or modifying the relationships type. Here we'll examine two aspects:
Cardinality
In Power BI cardinality plays an important role in defining the nature of relationships between tables within a data model. It specifies how the rows in the first table connected to the rows in the second table. When creating and editing relationships in power bi choosing an appropriate cardinality is very important for data analysis and reporting. By understanding and setting cardinality correctly users can navigate easily across related tables.
Cross-filter direction
In power bi every power bi model relationship is called cross-filter direction. Cross-filter directions dependent on cardinality type like Single and Both cross-filter direction type will be applied as One-to-Many or many-to-One cardinality type Both cross-filter type will applied as One-to-One cardinality type and Single (Table1 to Table2), Single (Table2 to Table1) Both cross-filter type will applied as Many-to-Many cardinality type.
Building Data Models in Power BI
By following thee below steps, we can build data models in Power BI:
1. Import Data: Connect to data sources and import relevant datasets into Power BI.
 Get Data
2. Transform Data: Use Power Query Editor to clean, transform, and shape data as needed.
 Transform data
3. Create Relationships: Define relationships between tables based on common fields.
 Manage Relationship
4. Build Measures: Use DAX (Data Analysis Expressions) to create custom calculations and measures.
 New Measure in Power BI
5. Building Visualizations
To build visualization in Power BI follow these step-
1. Select Visualizations: Choose the appropriate visualizations like bar chart, line chart, table for the type of insights needed.

2. Drag and Drop Fields: Drag and drop fields from the data model onto the appropriate areas of the chosen visualization.

3. Format Visual Elements: Customize visual elements such as colors, fonts and titles to enhance clarity and aesthetics.

4. Apply Filters: Utilize filters to focus on specific subsets of data within the visualizations.

How to Make Relationship Active
By following steps for making the relationship active are-
1. Open Power BI Desktop: Launch Power BI Desktop and open your Power BI project.
 Get Data
2. Navigate to "Relationships" View: Go to the "Model" view by clicking on the "Model" icon on the left side of the screen.

3. Identify the Relationship: Locate the relationship you want to activate between two tables.
 Autodetect Relationship
4. Edit Relationship: Right-click on the relationship line and choose "Edit Relationship" from the context menu.
 Create Relationship
5. Configure Relationship Options: In the "Edit Relationship" dialog, ensure that the "Active" option is checked.
 Active Relationship in Power BI
Overall in Power BI while creating a relationships and data model between tables you can easily understand reports and visuals.
Similar Reads
Creating Table Relationships in Power BI Desktop
Relationships are established between tables to connect them via an attribute and the tables can be considered as one whole table for further process. However, in many cases, Power BI creates relationships on its own. In this article, we will learn more about creating table relationships in Power BI
5 min read
Managing & Editing Table Relationships | Power BI
Managing and editing table relationships typically refers to the process of defining and maintaining the connections between tables in a relational database. Table relationships are crucial for maintaining data integrity, enforcing referential integrity, and ensuring efficient data retrieval. visual
6 min read
Creating APIs for Relational Database
In the era of software development, relational databases stand as pillars of structured data storage and organization. These databases, with their tables, rows, and columns, provide a reliable framework for managing information. But what makes them truly powerful is their collaboration with APIs, th
8 min read
Connecting Multiple Data Tables in Power BI
When you get data with different and multiple tables, you will look forward to knowing how these data relate to each other and have any relationship. Power BI helps us to understand with easy steps. Transform the data if you have to make changes and then load it.Power BI creates the relationship bet
4 min read
Managing Active vs. Inactive Relationships | Power BI
Managing active vs inactive relationships becomes very crucial when dealing with data models that involve multiple tables and relationships in Power BI. And before we start to talk about what are active or inactive relationships and how to manage them we should first know, What are relationships in
8 min read
Power BI - Data Sources and its type
In this article, we will be looking at Data Sources and their type in Power BI. Power BI is an interactive data visualization software developed by Microsoft with a primary focus on business intelligence. It is part of the Microsoft Power Platform. The Power BI data sources that are available are as
2 min read
Power BI - Create Drill Up and Drill Down Reports
A Power BI report is a multi-perspective view of a dataset that includes visual representations of the data's findings and insights. A report may contain just one image or numerous pages of images. You might be a person who designs reports or a business user who consumes reports, depending on your e
3 min read
How to Draw Entity Relationship Diagrams (ERDs)
Entity Relationship Diagrams serve as valuable tools for designing complex systems and their relationships. This article will go through the step-by-step process of designing an ER diagram and defining how entities, attributes, and relationships are defined. Entity relationship diagrams are importan
6 min read
Power BI - Tools and Functionalities
Power BI is a Data Visualization and Business Intelligence tool by Microsoft that converts data from different data sources to create various business intelligence reports. It provides interactive visualizations using which end users can create reports and interactive dashboards by themselves. It is
5 min read
Power BI - How to create a Report using Excel Data in Workspace?
Microsoft Power BI has multiple features and functions to make reports simple and easy to understandable through various techniques. Power BI also has a feature to generate reports using excel files. These excel files may be saved in the local file system or either web-based for example drive or sha
3 min read