


ABSTRACT
We have followed up on the results of a 65 deg2 CFHT/MegaCam imaging survey of the nearby M81 Group searching for faint and ultra-faint dwarf galaxies. The original survey turned up 22 faint candidate dwarf members. Based on two-color HST ACS/WFC and WFPC2 photometry, we now confirm 14 of these as dwarf galaxy members of the group. Distances and stellar population characteristics are discussed for each. To a completeness limit of  , we find a galaxy luminosity function slope of −1.27 ± 0.04 for the M81 Group. In this region, there are now 36 M81 Group members known, including 4 blue compact dwarfs; 8 other late types including the interacting giants M81, NGC 3077, and M82; 19 early type dwarfs; and at least 5 potential tidal dwarf galaxies. We find that the dSph galaxies in M81 appear to lie in a flattened distribution, similar to that found for the Milky Way and M31. One of the newly discovered dSph galaxies has properties similar to the ultra-faint dwarfs being found in the Local Group with a size Re ∼ 100 pc and total magnitude estimates
  and MI ∼ −9.1.
1. INTRODUCTION
As is often stated near the top of any paper on dwarf galaxies, these small, faint galaxies, following a continually rising galaxy luminosity function (LF) to faint magnitudes, are the most abundant galaxy type in the universe. However, at the faintest magnitudes, these objects are only readily visible in the local universe. Comprehensive searches for such faint objects are ongoing in the Local Group (see McConnachie 2012), with dwarfs as faint as MV ∼ −2 being discovered. Such extremely faint galaxies, with magnitudes fainter than MV ∼ −8.0 (Brown et al. 2012), have been termed ultra-faint dwarf (UFD) galaxies and can have magnitudes and surface brightnesses significantly lower than the previously established classical dwarfs. These new Local Group members are currently turning up at such high rates with wide field surveys such as the Sloan Digital Sky Survey (SDSS) that the number of known Local Group dwarfs has more than doubled in the past 15 years. However, we are far from achieving a complete census of galaxies in any environment, and even further from obtaining complete samples over a range of environments. Nearby, deep, and very wide field coverage is required to identify faint Andromeda satellites, while full sky coverage, which includes the zone of obscuration, is required for the Milky Way. More distant dwarf galaxy populations quickly suffer from incompleteness at faint magnitudes and low surface brightnesses.
Motivations for studying dwarf populations go well beyond these galaxies simply being the most plentiful in the universe. The lowest mass dwarfs may have been the first galaxies to form and may constitute relic building blocks within the hierarchical structure formation paradigm (Ricotti 2010). The faintest dwarf spheroidals (dSphs) may contain pure old stellar populations (Dolphin et al. 2005; de Jong et al. 2008; Brown et al. 2012). Measurements of the stellar velocity dispersions suggest these may be the most dark matter dominated objects in the universe (Simon & Geha 2007; Walker 2013). The relative abundance of these low-mass dwarfs with respect to more massive galaxies directly relates to cosmological structure formation models while abundance as a function of environment probes environment-dependent processes such as stripping, harassment, strangulation, merging, and pressure containment. Studying how star formation proceeds in galaxies with such small sizes and low gas masses and densities enables an understanding of star formation efficiencies and regulation processes. Investigating the different dwarf classes, namely dSphs and dwarf irregulars (dIs), may provide insight into when, how, and why star formation shuts off, along with an understanding of the relationship between early- and late-type galaxies.
In addition, dwarf galaxies impose strong constraints on cosmological models. Although the ΛCMD model satisfies most criteria on large scales, it continues to fail at faint galaxy magnitudes, where predictions of the galaxy abundance as a function of mass and of the internal structure of these small objects do not agree with observations of the galaxy LF or galaxy physical structure (Moore et al. 1999; Klypin et al. 1999). In low-density environments, this discrepancy is even larger. Simulations predict relatively larger fractions of small, faint galaxies, while observationally a flatter faint-end LF slope is usually found (Trentham et al. 2005; Blanton et al. 2005). For the faintest dwarfs, explanations abound, with various mechanisms such as reionization and feedback used to explain a reduction of baryonic matter residing in the dark matter halos and limiting star formation in low-mass halos (Thoul & Weinberg 1996; Larson 1974; Dekel & Silk 1986). At slightly brighter magnitudes, it becomes harder to justify differences from theory (Boylan-Kolchin et al. 2012), although Wang et al. (2012) find that some differences may be accounted for by assuming a slightly lower halo mass for the host galaxy.
Thus, dwarf galaxy observations inform cosmological formation and galaxy evolution theories. Studying dwarf properties—sizes and structures, colors, metallicities, stellar density and surface brightness, number counts as a function of magnitude, star formation rates and histories, gas content, stellar and halo masses, and environmental differences—along with the relations between luminosity, size, surface brightness, metallicity, velocity dispersion, and dynamical mass—are critical for constraining models of galaxy formation and evolution.
In an effort to obtain a sample of dwarf galaxies complete to faint limiting magnitudes in an environment outside the Local Group, we undertook a large survey to search for dwarf galaxies in the nearby M81 Group. At a distance of 3.7 Mpc this group is near enough to identify faint and small galaxies through just visible resolved stellar populations while at the same time is distant enough that obtaining complete areal coverage is feasible.
The M81 Group consists of a core dominated by M81. It is inferred from the distribution and velocities of satellites that M81 and its immediate satellites lie in a halo characterized by a current second turnaround radius (closely related to the virial radius) of ∼230 kpc or 3.65 deg in projection (Tully 2010). A secondary clump of galaxies dominated by NGC 2403 that lies ∼1 Mpc to the foreground of M81 is falling away from us toward the M81 halo. The smaller galaxies NGC 4236 and VII Zw 403 that lie ∼1 Mpc behind M81 are also falling toward M81. Karachentsev et al. (2002) find the total mass of the group within the zero velocity surface to be 1.6 × 10¹² M☉. This mass estimate is uncertain. A numerical action orbit reconstruction model gives a mass of 1.0 × 10¹³ M☉ (Jacobs et al. 2012). In the immediate vicinity of M81, the three major galaxies M81, M82, and NGC 3077 have undergone significant gravitational encounters within the past 300 Myr producing, through tidal disruption, H i bridges connecting all three galaxies and possibly inducing elevated star formation rates in these late type galaxies (in particular affecting NGC 3077 and the strongly starbursting galaxy M82; Yun et al. 1994). Within this tidal debris reside a number of suspected tidal dwarfs. The population around M81 also contains a large fraction of late galaxy types. Compared with the Local Group, to MV < −10, the late type fraction is higher: the Milky Way and Andromeda have ∼40% and 30% late types, respectively, while for M81 it is 55%. All of this suggests that this system is dynamically less evolved than the Local Group.
Using MegaCam on the Canada–France–Hawaii Telescope (CFHT), we imaged a total of 65 deg2 centered around M81, extending beyond the second turnaround radius of the group. Within this region are 22 previously known group members. In addition to recovering all the previously known systems, our MegaCam imaging survey turned up a total of 21 new candidate dwarf galaxy group members and one other previously suspected member (Chiboucas et al. 2009, hereafter Paper 1), potentially doubling the number of galaxies in the region around M81. We have since followed up with Hubble Space Telescope (HST) WFPC2 and ACS/WFC two-band imaging to generate color–magnitude diagrams (CMDs) from which to establish membership based on tip of the red giant branch (TRGB) distances and investigate the stellar populations of these faint and small dwarf galaxies. The results of this follow-up work are presented here.
In Section 2 we describe our original survey, the new HST observations, and the stellar photometry leading to TRGB distance measurements. Results, including confirmation of new M81 Group dwarf galaxy members are presented in Section 3.1. Structural and photometric properties for these new members can be found in Sections 3.3 and 3.4. The stellar populations of each new member are discussed in Section 3.5. A discussion of these new detections is found in Section 4 with summary and conclusions in Section 5.
2. OBSERVATIONS AND DATA REDUCTION
2.1. Initial Imaging Survey
The initial CFHT/MegaCam r'-band imaging survey was carried out over three semesters: 2005B–2006B. A contiguous 65 deg2 region centered on M81 was observed in a mosaic pattern which resulted in each region being imaged twice with combined total integration times of 1096 s. Full details of this survey are presented in Chiboucas et al. (2009). The M81 Group has a 230 kpc second turnaround radius of spherical collapse (Tully 2010) which, at the group distance of 3.7 Mpc, corresponds to 3.65 deg on the sky. The MegaCam survey therefore extends beyond this radius and provides nearly complete areal coverage of this nearby galaxy group. The survey limiting magnitude for resolved stars was r' ∼ 25.0–25.5, dependent on seeing variations throughout the survey. Given the high level of extinction in this part of the sky (Schlegel et al. 1998; Schlafly & Finkbeiner 2011; see Table 2), we found we could resolve stars down to  . The TRGB in r' is −3.1 ± 0.1. Stars at the TRGB are just at the edge of detection while young main-sequence (MS), red supergiants, and intermediate-aged asymptotic giant branch (AGB) stars are easily resolved over the low surface brightness diffuse late type MS population light.
Exploiting this, we searched the imaging for previously undetected faint dwarf galaxies. Our expectation was that any dwarf galaxy, no matter how faint or diffuse, should have been detectable, as long as it had built up a significant enough red giant branch. In retrospect from results discussed further along, this requirement of a well developed red giant branch is satisfied for galaxies brighter than  . Using two methods (a two-point correlation routine and visual inspection by two of the authors) to search for concentrations of resolved stars which would indicate potential dwarf galaxies, we identified a total of 22 candidate dwarf group members. This conceivably doubles the number of known group members, and includes three blue compact dwarfs (BCDs), a tidal dwarf, and a number of dI and dSph candidates. Three of the candidates were previously known galaxies. However, d0958+66 (KUG 0945+670) and d1012+64 (UGC 5497) had no velocity or distance measures that would associate them with the M81 Group. These two galaxies are compact star-forming objects which were found to resolve into individual stars in our MegaCam imaging and thus considered strong candidates for group membership. A third object, d0959+68, was originally noted by Durrell et al. (2004). In a survey for resolved red giant stars near the core of the M81 Group, they discovered a concentration of blue stars which they suggested was a likely tidal dwarf within the group.
Artificial galaxies having a wide range of sizes, total magnitudes, and stellar surface densities were inserted in the imaging to determine survey completeness and recovered using the same methods described above. Results indicated that limitations did exist for this survey, due in part to gaps between the CCDs and regions with very high extinction, and due to what are effectively total magnitude and surface brightness limits. Out to a distance beyond the second turnaround radius (roughly equivalent to the Virial radius), Chiboucas et al. (2009) contend that the survey is ∼90% complete to  .
.
2.2. HST Observations
In order to securely establish group memberships, we need to measure distances to these candidate galaxies. Previous work has shown that it is possible to measure TRGB distances for resolved stellar populations in dwarf galaxies out to ∼10 Mpc (see, e.g., Makarov et al. 2006; Rizzi et al. 2007; Jacobs et al. 2009). The M81 Group is nearby at ∼3.7 Mpc, a distance where the brighter members of galaxy stellar populations, including red giant stars, are resolved in single orbit space-based imaging. We therefore make use of the high resolution of HST to obtain two-color photometry of resolved stars in these candidates. From the resulting CMDs, we can measure the TRGB and use this to measure distances and confirm group membership. With the Advanced Camera for Surveys (ACS) on HST, we can reach V = 28.0 and I = 27.0 with integrations taken together in a single orbit. At the distance of the M81 Group, the TRGB is found at I ∼ 23.8, assuming MI, TRGB = −4.04 ± 0.12 for metal-poor populations (Bellazzini et al. 2001). ACS imaging probes deeper than 3 mag below the TRGB assuring secure determinations of the TRGB and, with uncertainties in the tip magnitude typically 0.1 mag, distance determinations accurate to 200 kpc. In addition, with effective radii ⩽30 arcsec, the 202 × 202 arcsec field of view of ACS provides essentially full coverage for these candidates. With WFPC2, the data only reach ∼1.5 mag below the TRGB, uncertainties in the distance measurement are larger, and bigger galaxies extend beyond the field of view.
Imaging was obtained in both F814W and F606W bands for each of our 22 candidates. Although Johnson–Cousins V- and I-band filters are traditionally used to obtain TRGB distances, the F814W filter transforms well to Cousins I, while the F606W provides adequate color separation and is chosen over the F555W for its greater throughput. An initial set of 14 candidates was observed in Cycle 16 (GO-11126). Due to the failure of the ACS, the program was carried out using the lower sensitivity WFPC2 camera. A second set of 8 candidates was observed with the repaired ACS/WFC (GO-11584) in Cycle 17. One candidate was re-observed with ACS in order to probe the stellar population to fainter magnitudes. Regardless of instrument, each candidate was observed in both bands in a single orbit. This meant two exposures with combined total integration times of 900–1000 s in F814W and 1000 s in F606W for WFPC2 observations, and ∼1250s in F814W and F606W for ACS/WFC observations. See Table 1 for a summary of observations. Thumbnail images of each candidate are shown in Figures 1–3. Color images are shown for a subset of these in Figures 4 and 5. Color figures for all can be found in the Extragalactic Distance Database (EDD) at http://edd.ifa.hawaii.edu.

Figure 1. F814W thumbnails for nine candidates observed with WFPC2. Images are 34 × 39 arcsec on each side.
Download figure:
Standard image High-resolution image
Figure 2. F814W thumbnails for another five candidates observed with WFPC2. Images are 34 × 39 arcsec on each side.
Download figure:
Standard image High-resolution image
Figure 3. F814W thumbnails for nine candidates observed with ACS. Images are 65 arcsec on each side.
Download figure:
Standard image High-resolution image
Figure 4. Clockwise from upper left, color images of d1012+64, d0944+71, d1015+69, and d0959+68 with log scaling. Color images were produced using the ACS F814W and F606W bands as red and green channels, respectively. Blue channel images were created by taking 2 × F606W − F814W images. Regions shown are 1.6 × 1.3 arcmin.
Download figure:
Standard image High-resolution image
Figure 5. Color images of the BCDs d0958+66 and d1028+70 observed with the WFPC2 camera. Color images are produced in the same manner as the ACS color images. WFC chip 2 images are displayed, with size 1.3 arcmin on a side.
Download figure:
Standard image High-resolution imageTable 1. Observation Summary
| Galaxy | Camera | F606texp (s)a | F814texp (s)a | α | δ (J2000.0) | PGC No. | Other |
|---|---|---|---|---|---|---|---|
| d0926+70 | WFPC2 | 1000 | 1000 | 09 26 27.9 | +70 30 24 | 5056943 | |
| d0934+70 | WFPC2 | 1000 | 1000 | 09 34 03.7 | +70 12 57 | 5056931 | |
| d0946+68 | WFPC2 | 1000 | 900 | 09 46 13.0 | +68 42 55 | ||
| d0955+70 | WFPC2 | 1000 | 1000 | 09 55 13.6 | +70 24 29 | 5056934 | |
| d0957+70 | WFPC2 | 1000 | 1000 | 09 57 12.4 | +70 12 35 | ||
| d0958+66 | WFPC2 | 1000 | 900 | 09 58 48.5 | +66 50 59 | 28826 | KUG 0945+670 |
| d0959+68b | WFPC2 | 1000 | 900 | 09 59 33.1 | +68 39 25 | 5056936 | |
| d1006+67 | WFPC2 | 1000 | 900 | 10 06 46.2 | +67 12 04 | 5056937 | |
| d1009+70 | WFPC2 | 1000 | 1000 | 10 09 34.9 | +70 32 55 | ||
| d1014+68 | WFPC2 | 1000 | 900 | 10 14 55.8 | +68 45 27 | 5056938 | |
| d1016+69 | WFPC2 | 1000 | 900 | 10 16 18.3 | +69 29 45 | ||
| d1028+70 | WFPC2 | 1000 | 1000 | 10 28 39.7 | +70 14 01 | 5056941 | |
| d1041+70 | WFPC2 | 1000 | 1000 | 10 41 16.8 | +70 09 03 | 5056942 | |
| d1048+70 | WFPC2 | 1000 | 1000 | 10 48 57.0 | +70 25 38 | ||
| d0939+71 | ACS | 1300 | 1250 | 09 39 15.9 | +71 18 42 | 5056932 | |
| d0944+69 | ACS | 1280 | 1230 | 09 44 22.5 | +69 12 40 | 5056933 | |
| d0944+71 | ACS | 1300 | 1250 | 09 44 34.4 | +71 28 57 | 5056944 | |
| d0959+68b | ACS | 1280 | 1230 | 09 59 33.1 | +68 39 25 | 5056936 | |
| d1012+64 | ACS | 1250 | 1160 | 10 12 48.4 | +64 06 27 | 29735 | UGC 5497 |
| d1013+68 | ACS | 1280 | 1230 | 10 13 11.7 | +68 43 45 | ||
| d1015+69 | ACS | 1280 | 1230 | 10 15 06.9 | +69 02 15 | 5056947 | |
| d1019+69 | ACS | 1280 | 1230 | 10 19 52.9 | +69 11 19 | ||
| d1020+69 | ACS | 1280 | 1230 | 10 20 25.0 | +69 11 50 |
Notes. aTotal integration from two exposures. bObserved with both WFPC2 and ACS.
Download table as: ASCIITypeset image
2.3. Stellar Photometry
We started with bias corrected and flat-fielded data produced by the STScI pipeline. Photometry was then performed using the point-spread function (PSF) fitting stellar photometry packages from A. Dolphin. HSTPHOT (Dolphin 2000b) was originally run on the WFPC2 data, while the ACS module of DOLPHOT was used for the ACS data. Pre-processing with these routines included bad column and hot pixel masking, cosmic ray rejection, and sky determination, as described in the manuals. Sources are then simultaneously detected and photometered in both F814W and F606W images, using PSF fitting with model PSFs from TinyTim.4 Aperture corrections were made based on stars in uncrowded regions. Charge-transfer inefficiency and zeropoint corrections are also applied, and measured magnitudes are provided as both flight system instrumental VEGAMAG magnitudes and as corresponding Johnson–Cousins transformed apparent magnitudes. Charge-transfer-efficiency (CTE) corrections and zeropoints are taken from Dolphin (2000a) for WFPC2 data, while DOLPHOT makes use of the newest Chiaberge (2012) CTE corrections and revised magnitude zeropoints from the STScI Web pages.
A detection threshold of 3.0σ was applied. This produced F814W and F606W matched catalogs with output including χ2 for the fit, S/N, sharpness, roundness, position angle, crowding, object type (distinguishing between star, faint, and elongated/extended objects), and magnitudes. We then culled this output to reject anything that was not considered a point source with sufficiently high S/N. Final object lists contained only those objects classified as stars with χ2 < 2.5, (sharpness)2 < 0.09, S/N >5 in both bands, and quality flag 0. Final lists consisted of ∼10, 000 and typically less than 1000 good stars in ACS and WFPC2 fields, respectively.
Using artificial stars, we tested the detection completeness and photometric uncertainties of HSTPHOT/DOLPHOT. Between 100,000–200,000 sources were added using the Dolphin routines to WFPC2 and ACS imaging, one at a time so as to not introduce additional crowding. HSTPHOT/DOLPHOT were then run in the same way to recover these artificial sources, including implementing the same rejection parameters that were applied to the real data. Detection completeness is shown in Figure 6. For WFPC2 data, we find an F814W 50% completeness limit of ∼25.5 ± 0.2. The crowding of each field appears to affect the recovery rate, with crowded fields reaching ∼0.2 mag shallower than this and sparser fields probing ∼0.2 mag deeper. F606W data go 1.2 mag deeper than the F814W data. For ACS data, the difference in depth due to crowding is as large as ∼0.8 mag between dense and uncrowded fields. We find a 50% completeness limit of ∼27.3 ± 0.4 in F814W. F606W data reach about 1 mag deeper. At the TRGB at F814W ∼ 23.8, we expect 100% completeness in all datasets. For WFPC2 data, the 50% completeness limit is less than 2 mag below the tip. However, even in crowded fields, we expect completeness to be >90% one magnitude below the tip.

Figure 6. Stellar detection completeness in our WFPC2 and ACS imaging from false star tests with HSTPHOT. These examples show the completeness in F814W and F606W bands for both crowded (d0958+66, d1012+64) and uncrowded fields (d0955+70, d1015+69). Detections reach about 2 mag deeper in the ACS data. Additionally, detections in uncrowded fields go slightly deeper than for crowded fields in both WFPC2 and ACS imaging. As shown for the ACS examples, the ∼50% completeness is about a half magnitude deeper for the uncrowded field. Error bars are from Poisson statistics.
Download figure:
Standard image High-resolution imageUncertainties in the photometry are also investigated using the artificial star tests. Results are displayed in Figure 7. The scatter at faint magnitudes becomes quite large. At F814W = 23.5, close to the expected TRGB magnitude for M81 Group members, the 1σ uncertainty is ∼0.055 mag for ACS and 0.11 mag for WFPC2 data. The uncertainty is slightly higher, by ∼0.03 mag, for the most crowded fields in each case. For individual stars at the TRGB, this translates to an uncertainty in distance of 100 and 200 kpc for ACS and WFPC2 data, respectively. The second turnaround radius for the M81 Group is 230 kpc, within which we expect all galaxies to be group members. Since the TRGB measurement is based on the ensemble of stars at the TRGB, the uncertainty decreases with increasing number of stars populating the upper TRGB. Makarov et al. (2006) find that the maximum likelihood method for determining the TRGB which we implement should produce reasonable results for RGBs consisting of >50 stars in the top magnitude before the tip. Thus, the photometric uncertainties are within the range needed to unambiguously establish group membership, at least for galaxies with an RGB population size sufficient for determining the location of the RGB tip.

Figure 7. Magnitude and color measurement errors from false star tests using HSTPHOT (WFPC2) and DOLPHOT (ACS). These examples show the results for galaxy d1028+70 observed with WFPC2 and d1012+64 observed with ACS, where the false stars shown were added to the same chip as the location of real galaxies. Over 100,000 and 200,000 stars were added to each of the WFPC2 and ACS images, respectively, of which over 60,000 were recovered as good stars within 3 Re of the real galaxy centers.
Download figure:
Standard image High-resolution imageCMDs for all candidates are shown in Figures 8–11. Error bars denote 1σ uncertainties in magnitude and color as determined from the artificial star tests. The most prominent feature in many of these CMDs is the RGB at F606W − F814W ∼ 0.8, the presence of which is confirmation of the galaxian nature of these objects. The RGB is visible as a long, narrow strip in the ACS data, seen in at least five of the top six panels of Figure 8. For d0959+68 the presence of an RGB is more questionable. Since all candidates were centered in the WFC chip 2, we show the CMDs for stars in the bottom detector for several cases in Figure 9. Hints of an RGB in d0959+68 may indicate that the target extends onto the other CCD. The RGB has a wedge-shaped appearance in candidates shown in Figure 10 observed with WFPC2. The broadness at the detection limit is primarily due to large photometric errors. No such feature is apparent in the remaining five candidates observed with WFPC2 (Figure 11). For comparison we also include in this plot the stellar detections for the d0926+70 observation taken from a different chip away from where the target was centered and which exhibits fewer stellar detections. We have no independent control fields, but as many of our galaxies are spatially quite small, we can use part of some of the images as an approximation of the expected foreground stellar contamination.

Figure 8. CMDs within a 50'' × 50'' region centered on each of the nine candidate M81 dwarf galaxies imaged with ACS. Error bars denote photometric uncertainties. RGBs are evident in at least five of these panels, at (F606W − F814W) ∼ 0.8, and may be present in d0959+68.(Supplemental data for this figure are available in the online journal.)
Download figure:
Standard image High-resolution image
Figure 9. CMDs for stars in ACS/WFC 1 for six pointings. All candidates were centered in WFC 2. Error bars denote photometric uncertainties. Hints of an RGB may be present in d0959+68, indicating that the galaxy extends into this chip.(Supplemental data for this figure are available in the online journal.)
Download figure:
Standard image High-resolution image
Figure 10. CMDs for nine candidate M81 dwarf galaxies imaged with WFPC2. Error bars denote photometric uncertainties. Data from chip 3 are plotted only. In eight cases, an RGB is evident as a wedged-shaped structure at (F606W − F814W) ∼ 0.8. In one case, d0959+68, no RGB is apparent, but we expect this object to be a group member for reasons described in the text.(Supplemental data for this figure are available in the online journal.)
Download figure:
Standard image High-resolution image
Figure 11. CMDs for five additional candidate M81 dwarf galaxies imaged with WFPC2. Error bars denote photometric uncertainties. There are no obvious RGBs. The bottom right panel shows the CMD from WFPC2 detector 2 for the d0926+70 pointing. All candidates are centered in detector 3.(Supplemental data for this figure are available in the online journal.)
Download figure:
Standard image High-resolution imageIn a few of these CMDs (d0959+68, d1012+64, d0958+66, and d1028+70), an MS is visible as a vertical strip around F606W − F814W ∼ −0.2. Blue loop stars are also likely present at bright magnitudes. These stars indicate the existence of a young stellar population. AGB stars, representative of intermediate-age populations, are also apparent in some of these CMDs above and redward of the RGB. These populations will be discussed further in Section 3.5.
2.4. TRGB Measurements
Red giant stars have ceased hydrogen burning in their cores while continuing to burn hydrogen in outer shells. This shell burning causes the outer envelope of the star to expand and become redder and brighter while dumping material on a degenerate core, thereby increasing the core mass and temperature. Because of the degeneracy, the star cannot compensate for the increased core temperature and, when the core reaches the required temperature, at a constant core mass and therefore a predictable luminosity, the onset of helium burning occurs as a runaway thermonuclear reaction. The degeneracy is lifted before the star explodes, and the star then spends the next stage of its life on the lower-luminosity horizontal branch. Thus, the TRGB, immediately before a star undergoes the helium flash, has a near constant bolometric luminosity and can therefore be used as a standard candle. Although this luminosity is strongly dependent on the underlying stellar population metallicity and, to a much lesser extent, the population age, it is least sensitive to these evolutionary variables in the I band (Rizzi et al. 2007).
Accurate TRGB distance measurements can therefore be made with good calibration for the I-band tip luminosity. For this, we use the work of Rizzi et al. (2007). They define a zeropoint calibration of the TRGB, accurate to 1% statistical uncertainty, as a function of the stellar population color to account for variation due to metallicity and age. In addition, the zeropoint is provided in the HST flight system for F606W and F814W for both ACS and WFPC2 cameras. They find

The measurement of the TRGB can therefore be made directly within the flight system magnitudes as measured by DOLPHOT/HSTPHOT, eliminating additional uncertainty from magnitude transformations into the Johnson–Cousins system.
In order to determine the precise location of the apparent magnitude of the tip we use the maximum likelihood method of Makarov et al. (2006), as described in Jacobs et al. (2009). This has the advantage over edge detection algorithms in that no binning or smoothing is required, although a functional form must be assumed for the stellar LF. We use the TRGBTOOL program written by D. Makarov which assumes a simple power law with a cut-off faintward of the TRGB and a second power law with a different slope brightward. Default values for the slopes are provided although these can be varied as necessary to fit the data. The discontinuity in the fit determines the TRGB location. The procedure incorporates the results of the artificial star tests discussed above to account for completeness, crowding, and photometric errors and provides realistic uncertainties in the tip measurements.
We run TRGBTOOL on HSTPHOT/DOLPHOT photometry for all the candidates. In most cases where we believe an RGB is visible in the CMD, the automated tip finder locates a tip magnitude close to the expected value for M81 Group members. In several cases, e.g., d0934+70 and d0959+68, the RGB is so poorly populated that uncertainties in the tip measurement are very large. In addition, for d0959+68 the tip measurement obtained from the tip finding software may be affected by AGB stars. The few cases with well populated RGBs have small TRGB measurement errors and well constrained distances.
3. RESULTS
3.1. Confirmation of 14 New M81 Companions
The spatial distribution of detected stars in WFPC2 and ACS images for 14 candidates are displayed in Figures 12–16. Symbols are coded by region of the CMD. Black points denote all good stellar detections. Red pentagons are stars that fall within the range of the RGB: F814WTRGB < F814W < 25 and 0.4 < F606W − F814W < 1.4. Black asterisks represent possible intermediate-age AGB stars having F814W < F814WTRGB and F606W − F814W > 0.6. Blue open triangles denote potential young MS and blue loop stars with F814W < 25 and F606W − F814W < 0.2.

Figure 12. Locations of detected stars in the WFPC2 fields. Black dots denote all "good" stars recovered by HSTPHOT. Red pentagons are stars within the range of the RGB: F814WTRGB < F814W < 25 and 0.4 < F606W − F814W < 1.4, black asterisks represent possible AGB stars having F814W < 23.4 and F606W − F814W > 0.6, and blue open triangles denote potential MS and blue loop stars with F814W < 25 and F606W − F814W < 0.2.
Download figure:
Standard image High-resolution image
Figure 13. Locations of detected stars in the WFPC2 fields. Symbols as in Figure 12.
Download figure:
Standard image High-resolution image
Figure 14. Locations of d0959+68 stars observed with both WFPC2 and ACS cameras. Symbols as in Figure 12 with limiting depth of F814W < 26.5 for ACS RGB and MS stars.
Download figure:
Standard image High-resolution image
Figure 15. Locations of detected stars in the ACS fields. Red pentagons are stars within the range of the RGB: F814WTRGB < F814W < 26.5 and 0.4 < F606W − F814W < 1.4, black asterisks represent possible AGB stars having F814W < 23.4 and F606W − F814W > 0.6, and blue open triangles denote potential MS and blue loop stars with F814W < 26.5 and F606W − F814W < 0.2.
Download figure:
Standard image High-resolution image
Figure 16. Locations of d1012+64 stars in the ACS fields. Symbols as in Figure 15.
Download figure:
Standard image High-resolution imageAlthough the stellar detections have been culled for only "good" stars, some artifacts are still present in the ACS imaging. All 14 objects shown here exhibit obvious concentrations of stars at the targeted location of the candidate, further proof that these are real galaxies. WFPC2 images not only have shallower magnitude limits than ACS, but cover smaller regions on the sky, with a field of view of only ∼150 × 150 arcsec as compared to the larger 202 × 202 field of ACS. Although concentrations are obvious in WFPC2 chip 3, the stellar populations spill out onto the other chips and outside the field of view. The smaller dwarfs observed with ACS are largely contained within the imaging; larger galaxies extend beyond the ACS images.
Many of these objects consist predominantly of RGB stars with perhaps a handful of stars in the AGB range. These two stellar types have similar distributions. A few objects exhibit evidence for a younger stellar population with upper MS and blue loop stars. These are found as concentrations in the core for some cases and scattered throughout the object in others. A wide range of galaxy sizes and stellar population densities is noted.
In Figures 17–25 we show the extinction-corrected CMDs of all expected members. Extinction in the ACS and WFPC2 bandpasses was determined using the reddening values from the dust maps of Schlegel et al. (1998) with the recalibration for extinction in different bandpasses by Schlafly & Finkbeiner (2011), as provided in their Table 6 assuming a Fitzpatrick (1999) reddening law with RV = 3.1. The measured location of the TRGB is indicated with a broken solid line while dashed lines denote the uncertainty in the tip location. Table 2 provides TRGB F814W magnitude measurements, along with the extinction-corrected values, associated tip absolute magnitudes calculated as a function of TRGB color, and the resultant distance moduli and calculated distances. In addition, we correct our previous estimates of absolute r' magnitude (see Paper 1) for these new distance measurements. Uncertainties in extinction are not taken into account, so total uncertainty in distance measurements is expected to be larger.

Figure 17. CMD for the BCD, d1012+64, observed with ACS. The TRGB is indicated by a horizontal broken solid line with 1σ uncertainties represented by dashed lines. Stellar detections from the full ACS WFC chip 2 are shown. Stellar isochrones from Padova models (Marigo et al. 2008) are provided for constant age 12.5 Gyr and, from left to right, metallicities Z = 0.0001, 0.001, 0.002, 0.004, and 0.01 (red, up to the TRGB). Tracks for (left to right) 1, 2, and 4 Gyr intermediate-age AGB stars are coded in blue with Z = 0.003, 0.003, and 0.002, respectively. Isochrones for young stellar populations are shown in cyan for (left to right) ages 20, 30, 60, and 80 Myr with Z = 0.008, and 200, 500, and 750 Myr with Z = 0.004.
Download figure:
Standard image High-resolution image
Figure 18. CMDs for two M81 BCDs observed with WFPC2 in chip 3. The TRGB is indicated by a horizontal broken solid line with 1σ uncertainties represented by dashed lines. For both galaxies, red isochrones correspond to old 12.5 Gyr RGB stars (left to right: Z = 0.0001, 0.001, 0.002, 0.004, 0.01), while blue isochrones represent intermediate-age AGB sequences for (left to right) ages 1, 2, and 4 Gyr with Z = 0.002. Young stellar population isochrones are color coded cyan. For d0958+66, these correspond to (left to right) ages 20, 30, 60, 80, 200, and 500 Myr with Z = 0.004, and 750 Myr with Z = 0.003, while for d1028+70 these are displayed for ages 20, 30, 60, 80, and 200 Myr with Z = 0.003, and ages 350 and 500 Myr with Z = 0.002.
Download figure:
Standard image High-resolution image
Figure 19. CMD for a transition dI/dSph, d0926+70, observed with WFPC2. Data from chip 3 are displayed. The broken solid line denotes the best-fit TRGB, the dashed lines represent the 1σ uncertainties in the RGB tip measurement. Red isochrones correspond to old 12.5 Gyr RGB stars (left to right: Z = 0.0001, 0.001, 0.002, 0.004, 0.01), blue tracks correspond to intermediate-age AGB stars (1 Gyr with Z = 0.0015 and 4 Gyr with Z = 0.001), and cyan represent young populations for (left to lower right): 80 Myr with Z = 0.002 and 150, 270, and 500 Myr with Z = 0.0015.
Download figure:
Standard image High-resolution image
Figure 20. CMD and associated TRGB for dwarf spheroidal d0944+71 observed with ACS. Stellar detections from the full ACS WFC 2 detector are shown. Stellar isochrones from Padova models (Marigo et al. 2008) are provided for constant age 12.5 Gyr and, from left to right, metallicities Z = 0.0001, 0.001, 0.002, 0.004, 0.01 (red, up through the RGB phase) and for ages 1 and 2 Gyr with Z = 0.003 and 0.002, respectively (blue, AGB phase). Cyan sequences represent young stellar populations with ages 90 and 150 Myr with Z = 0.01 and 600 Myr with Z = 0.004 (left to right).
Download figure:
Standard image High-resolution image
Figure 21. CMDs and associated best-fit TRGBs (solid broken line) for two dSphs observed with ACS. Stellar detections within a 1 arcmin2 region centered on the target are displayed. 1σ uncertainties are denoted by dashed lines. Isochrones correspond to old 12.5 Gyr RGB stars (left to right: Z = 0.0001, 0.001, 0.002, 0.004, 0.01).
Download figure:
Standard image High-resolution image
Figure 22. CMDs and best-fit TRGB denoted (solid broken line) for another two dwarf spheroidals. d1015+69 and d0934+70 were observed with ACS and WFPC2, respectively. For d1015+69, stellar detections from a 1 arcmin2 region are plotted. For d0934+70, we show only stellar detections from WFPC2 chip 2. Overlaid are stellar isochrones for constant age 12.5 Gyr and, from left to right, metallicities Z = 0.0001, 0.001, 0.002, 0.004, 0.01 (up to the RGB phase). For d0934+70, we additionally include an AGB isochrone (blue) for an intermediate-aged 1 Gyr population with Z = 0.002.
Download figure:
Standard image High-resolution image
Figure 23. CMDs for two dSphs observed with WFPC2. Data from chip 3 are displayed. The broken solid line denotes the best-fit TRGB, the dashed lines represent the 1σ uncertainties in the RGB tip measurement. Isochrones correspond to old 12.5 Gyr RGB stars (left to right: Z = 0.0001, 0.001, 0.002, 0.004, 0.01).
Download figure:
Standard image High-resolution image
Figure 24. CMDs with TRGBs shown for another two dSphs with data from WFPC2 in chip 3. Isochrones correspond to old 12.5 Gyr RGB stars (Red, left to right: Z = 0.0001, 0.001, 0.002, 0.004, 0.01). Two intermediate-aged AGB tracks of 1 and 4 Gyr with Z = 0.002 are also shown (left to right).
Download figure:
Standard image High-resolution image
Figure 25. CMD and best-fit TRGB denoted (solid broken line) for tidal dwarf galaxy d0959+68. Stellar detections from the full ACS WFC chip 2 are shown. Stellar isochrones are shown for constant age 12.5 Gyr and, from left to right, metallicities Z = 0.0001, 0.001, 0.002, 0.004, 0.01 (red, up to the TRGB), and for a single 4 Gyr intermediate-aged AGB population with Z = 0.002 (blue). Isochrones for young stellar populations are displayed for (left to right, cyan): 30, 60, and 80 Myr with Z = 0.008, and 200 and 400 Myr with Z = 0.004.
Download figure:
Standard image High-resolution imageTable 2. Distances and Photometric Properties of M81 Group Members
| Galaxy | Cam |  a a |
μ○a | 〈μe〉a | EB − Vb | TRGBmeas | TRGBo | (V − I)tip | Mtipc | DM | D |  d d |
MIe | Type |
|---|---|---|---|---|---|---|---|---|---|---|---|---|---|---|
| r' | r' | F814W | F814W | (Mpc) | ||||||||||
| d0926+70 | W | 17.9 | 26.0 | 26.2 | 0.19 |  |
 |
1.00 ± 0.07 | −4.03 |  |
 |
 |
−11.4 | dI/dSph |
| d0934+70 | W | 18.0 | 26.2 | 26.4 | 0.25 |  |
 |
1.00 ± 0.07 | −4.02 |  |
 |
 |
−10.5 | dSph |
| d0939+71 | A | 18.5 | 25.5 | 26.1 | 0.04 |  |
 |
1.02 ± 0.03 | −4.10 |  |
 |
 |
−9.6 | dSph |
| d0944+69 | A | 21.1 | 25.9 | 26.7 | 0.09 |  |
 |
1.05 ± 0.05 | −4.10 |  |
 |
 |
−9.1 | dSph |
| d0944+71 | A | 15.2 | 23.4 | 23.9 | 0.03 |  |
 |
1.13 ± 0.07 | −4.08 |  |
 |
 |
−13.2 | dSph |
| d0955+70 | W | 17.9 | 26.6 | 27.1 | 0.16 |  |
 |
1.05 ± 0.07 | −4.02 |  |
 |
 |
−10.6 | dSph |
| d0958+66 | W | 14.7 | 21.6 | 22.3 | 0.07 |  |
 |
1.00 ± 0.07 | −4.03 |  |
 |
 |
−13.7 | BCD |
| d0959+68f | A | 16.2 | 26.0 | 25.5 | 0.08 |  |
 |
1.10 ± 0.10 | −4.09 |  |
 |
 |
−11.8 | dI/tdl |
| d1006+67 | W | 18.0 | 26.2 | 26.5 | 0.06 |  |
 |
1.12 ± 0.04 | −4.01 |  |
 |
 |
−10.3 | dSph |
| d1012+64 | A | 14.5 | 21.5 | 22.3 | 0.02 |  |
 |
1.10 ± 0.04 | −4.09 |  |
 |
 |
−13.9 | BCD |
| d1014+68 | W | 18.5 | 27.2 | 27.3 | 0.05 |  |
 |
1.00 ± 0.07 | −4.03 |  |
 |
 |
−10.5 | dSph |
| d1015+69 | A | 19.1 | 25.5 | 26.0 | 0.05 |  |
 |
1.00 ± 0.04 | −4.11 |  |
 |
 |
−9.5 | dSph |
| d1028+70 | W | 15.5 | 22.4 | 23.3 | 0.04 |  |
 |
1.03 ± 0.05 | −4.02 |  |
 |
 |
−13.1 | BCD |
| d1041+70 | W | 18.5 | 26.1 | 26.2 | 0.06 |  |
 |
1.03 ± 0.08 | −4.02 |  |
 |
 |
−10.7 | dSph |
Notes. aMagnitude and surface brightness measurements from CFHT/MegaCam r' imaging (Chiboucas et al. 2009). bFrom Schlegel et al. (1998) dust maps; this was converted to extinction in each bandpass using the Schlafly & Finkbeiner (2011) recalibration of the dust maps. cAbsolute magnitude of the TRGB using the calibration from Rizzi et al. (2007). dIntegrated magnitude from the curve of growth fitting with cumulative Sersic function based on MegaCam imaging; extinction-corrected (Chiboucas et al. 2009). eEstimated magnitudes assuming model stellar populations for each galaxy; see the text. Uncertainties are typically 0.4 mag for ACS data and 0.6 mag for WFPC2. fTRGB measurements may apply only to tidal stream stars and not to the star-forming concentration proposed to be a tidal dwarf.
Download table as: ASCIITypeset image
The largest uncertainty in TRGB measurements is for object d0934+70. This galaxy appeared to be strongly affected by galactic cirrus in MegaCam imaging, and is in a region with high extinction according to the dust maps of Schlegel et al. (1998). The RGB is poorly populated, leading to the large uncertainty in TRGB measurement. The RGB is also strangely shaped, displaying what appears to be color/metallicity shifts along the extension of the RGB. This could perhaps be caused by the low number statistics and large photometric errors, or by high and variable extinction spatially across this object. The maximum likelihood best-fit distance is 3.0 Mpc, but an extinction over-correction would produce an underestimate in the measured distance. We believe this may be the case. The large 1σ uncertainties place the distance between 2.8–4.1 Mpc. In comparison to the CMDs generated from "field" stars in regions on the detectors away from the targeted objects, there are significantly more stars associated with this object and these are arranged largely along the expected location for an RGB. Because of this, and coupled with the object's spatial location in the group, we consider it an M81 Group member, albeit with an uncertain distance measurement.
One object, d0959+68, was observed with both WFPC2 and ACS. We do obtain a TRGB measurement for this object from ACS data, with corresponding distance 4.2 Mpc. However, we consider this measurement uncertain due to the likely contamination of the RGB region with AGB stars. The majority of stars associated with this object are blue, young, MS, and blue loop stars. Since this object lies right along the tidal stream between M81 and NGC 3077, and given its young population and lack of a built-up RGB, we consider this object to be a tidal dwarf formed along this bridge of material likely having a distance similar to that of these two giants, ∼3.7–3.9 Mpc.
Other objects, d0926+70, d0955+70, d1006+67, d1014+68, d1041+70, d0939+70, d0944+69, and d1015+69, have uncertainties in distance ranging from 200 kpc to 1 Mpc. The TRGB measurements themselves place all of these objects near M81 at 3.69 Mpc. The large uncertainties are due to the nature of these objects. They all appear to be small dwarfs with very small stellar populations. With such poorly populated RGBs, the uncertainties in the distance measurements will be large. We expect these dwarf galaxies are all associated with the M81 Group.
Finally, four objects have small uncertainties in the tip magnitude due to the much more populated RGBs. Three of these were considered to be BCD galaxies in our first paper and are now established to be associated with the M81 Group. These are small objects with reasonably large and concentrated stellar populations consisting of both old stars in a well developed RGB and younger MS, blue loop, and AGB stars.
Thus, based on the distance measurements from the CMDs along with supporting evidence from concentrations of resolved stars at the targeted locations of the candidates, we confirm a total of 14 new M81 companion dwarf satellites. Of the original 22 candidates, 12 were expected to be members based on the degree of resolution of the stellar population in r' MegaCam imaging. Of these, we find that 11 are bona fide members of the M81 Group. Of 6 candidates that we thought were galaxian in nature but were uncertain members due to a lower degree of resolution, we find that 3 are indeed M81 Group members while 3 are non-members and likely more distant dwarf galaxies. Of the final 4 candidates considered to be possible artifacts or distant galaxy clusters, none prove to be group members. Nine of these confirmed M81 Group members exhibit predominantly RGB sequence stars in their CMDs displaying little or no evidence for any AGB, blue loop, or MS stars. These are the dSph galaxies. A tenth object may also contain a small number of younger stars. The remaining 4 dwarfs all exhibit more significant younger populations in their CMDs. We display the projected and three-dimensional (3D) distribution of 22 previously known and 14 new M81 Group members within the region of our survey in Figure 26. Table 3 lists the projected and physical separations of each group galaxy from M81. CMDs, spatial distributions, and color figures for each of these galaxies can also be found in the Extragalactic Distance Database (EDD), at http://edd.ifa.hawaii.edu, by selecting the catalog CMDs/TRGB.

Figure 26. Top: projected distribution of all known M81 Group members within this region of the sky. The box indicates the original survey region and the dashed circle the projection of the putative surface of second turnaround at 230 kpc from M81. Late, early, and tidal dwarf galaxy types are denoted by symbol: blue circles, red hexagons, and green squares, respectively. Size indicates surface brightness with larger points shown for galaxies with brighter effective surface brightness. BCDs are encircled and the 14 new detections are outlined. Bottom: 3D distribution in supergalactic Cartesian coordinates. Symbols, sizes, and colors as in the 2D plot.
Download figure:
Standard image High-resolution imageTable 3. Projected and Physical Separation of Group Galaxies from M81
| Galaxy | Projected | Physical |  |
Re | Type |
|---|---|---|---|---|---|
| (deg) | (Mpc) | (kpc) | |||
| M81 | 0.00 | 0.00 | −20.6 | 1.45 | Sb |
| KDG61 | 0.49 | 0.043 | −13.3 | 0.68 | dSph |
| BK5N | 1.16 | 0.071 | −11.7 | 0.40 | dSph |
| N2976 | 1.38 | 0.094 | −18.0 | 0.77 | Sc/pec |
| IKN | 1.32 | 0.095 | (−12.4) | dSph | |
| M82 | 0.62 | 0.099 | −19.9 | 1.05 | Irr |
| FM1 | 0.98 | 0.101 | −11.7 | 0.39 | dSph |
| KDG64 | 1.63 | 0.119 | −13.2 | 0.40 | dSph |
| F8D1 | 1.87 | 0.127 | −13.2 | 1.22 | dSph |
| d0944+69 | 1.01 | 0.127 | −6.8 | 0.09 | dSph |
| Garlnd | 0.82 | (0.135) | pec/tdl | ||
| d1014+68 | 1.77 | 0.156 | −9.4 | 0.37 | dSph |
| HolmIX | 0.18 | (0.156) | −13.9 | 0.87 | dI/tdl |
| KK77 | 1.64 | 0.158 | −13.0 | 0.68 | dSph |
| d1006+67 | 2.14 | 0.163 | −9.8 | 0.32 | dSph |
| d0939+71 | 2.63 | 0.173 | −9.4 | 0.27 | dSph |
| KDG63 | 2.67 | 0.177 | −13.0 | 0.44 | dSph |
| d0958+66 | 2.24 | 0.179 | −13.2 | 0.22 | BCD |
| N3077 | 0.78 | 0.181 | −17.8 | 0.70 | Irr |
| DDO78 | 3.18 | 0.227 | (−12.8) | 0.43 | dSph |
| d1028+70 | 3.10 | 0.228 | −12.4 | 0.25 | BCD |
| d1015+69 | 1.75 | 0.237 | −8.8 | 0.16 | dSph |
| A0952 | 0.27 | (0.238) | pec/tdl | ||
| d0955+70 | 1.34 | 0.260 | −9.8 | 0.31 | dSph |
| d1041+70 | 4.12 | 0.265 | −9.3 | 0.19 | dSph |
| HS117 | 3.01 | 0.308 | −12.1 | 0.38 | dI |
| I2574 | 3.04 | 0.322 | −17.7 | 2.71 | SABm |
| DDO82 | 3.39 | 0.329 | −15.1 | 0.65 | Im/BCD |
| d0944+71 | 2.59 | 0.335 | −12.4 | 0.30 | dSph |
| d1012+64 | 5.24 | 0.337 | −13.5 | 0.25 | BCD |
| d0926+70 | 2.89 | 0.345 | −9.8 | 0.24 | dI/dSph |
| HolmI | 2.48 | 0.363 | −14.6 | 1.30 | dI |
| BK3N | 0.18 | (0.475) | −10.3 | 0.14 | dI/tdl |
| BK6N | 4.81 | 0.488 | −11.7 | 0.27 | dSph |
| d0959+68 | 0.54 | (0.508) | −11.9 | 0.54 | dI/tdl |
| d0934+70 | 2.19 | (0.705) | −9.4 | 0.22 | dSph |
Notes. Values listed in parentheses are highly uncertain, especially for suspected tidal dwarfs where distances measured from RGB stars may apply to nearby galaxies/tidal streams rather than the tidal dwarf itself.
Download table as: ASCIITypeset image
3.2. Spatial Distribution
Figure 27 shows a projection of the 3D distribution of all known galaxies within a cube centered on M81 and extending 600 kpc on the cardinal axes. The plot is in supergalactic Cartesian coordinates and the orientation is chosen so measured distances (and their errors) are in the line of sight. This orientation allows a projection of the Schlegel et al. (1998) dust map to be superimposed as a reminder that a band of cirrus crosses the region. Revised (Schlafly & Finkbeiner 2011) selective to total extinction E(B − V) values reach 0.22 at the location of one of our galaxies, although the values are below 0.1 for 85% of cases, with a median of 0.06.

Figure 27. Distribution of M81 galaxies within our survey region (gray box). Contours from the Schlegel et al. (1998) dust maps are overlaid. Solid red (orange) circles represent new (previously known) gas-deficient galaxies while open symbols denote gas-rich galaxies. Larger symbols are used for BCDs.
Download figure:
Standard image High-resolution imageThe gas-deficient systems are given emphasis in this plot, with the new dSph/non-star-forming galaxies colored red and previously known gas-deficient systems colored orange. Normal giant and dwarf galaxies with both young and old stars and detected H i (Begum et al. 2008; Roychowdhury et al. 2012) are identified by open symbols, with the three newly discovered cases given emphasis. Five tidal dwarfs (young stars but no convincing evidence of old stars) are identified by green triangles. The measured TRGB distances for the tidal dwarfs are considered quite unreliable since the RGB stars in these fields may not be associated with the targets. All the tidal dwarfs are in close proximity to M81 in projection and we assume the M81 distance of 3.69 Mpc for them.
The projection chosen with Figure 27 is minimally influenced by errors in distance. We note an apparent flattening of the distribution of gas-deficient systems to the supergalactic equatorial plane. M81 itself lies just 40 kpc off this plane. The significance of this configuration can be evaluated from the histograms in Figure 28. The galaxy KKH57 lies outside the CFHT survey region so it will not be considered further. Of the 20 gas-deficient galaxies in the survey region only d1041+70 deviates substantially from the supergalactic mid-plane (or more precisely, a plane parallel to the supergalactic equator displaced 40 kpc to pass through M81). The rms deviation in supergalactic latitude (SGB) with respect to M81 is ±61 kpc for 19 galaxies excluding d1041+70. By contrast, the rms deviation in supergalactic longitude (SGL) with respect to M81 is ±123 kpc for the same galaxies. The difference between SGB and SGL scatter has a 95% probability of significance; that is, there is suggestive but not conclusive evidence for a physical flattening. The tentative postulation is that this sample on a scale of a few hundred kpc shares flattening about the same pole as the 50 times larger structure that it is embedded in, the Local Sheet (Tully et al. 2008).

Figure 28. Left: cumulative distribution of the projected separation of early- and late-type galaxies from M81. Right: histogram showing the number counts of gas-deficient group members as a function of distance from M81 along supergalactic latitude and longitude.
Download figure:
Standard image High-resolution imageFor the same 19 galaxies the scatter in distance is ±231 kpc. This value is the convolution of true scatter and measurement errors. If the true scatter in the line of sight is the same as the scatter in the SGL then measurement errors at the level of 5% are implied. This estimate of errors is in accordance with our expectation. This level of error in distances limits our ability to define the properties of a putative plane in the distribution of the M81 dwarfs. It can be supposed that such a plane is tilted to our line of sight. However, it would be necessary to have distances accurate to 1% to evaluate such a scenario, well beyond our present capability.
It is evident from Figure 27 that the distribution of galaxies with gas and young populations does not manifest the flattening seen by the gas-poor systems. Discounting M82 and NGC 3077, which are directly engaged in an encounter with M81, the later-type systems are at greater projected radii from M81 than the early types. This difference is illustrated in Figure 28. It is a familiar pattern (Grebel 1997; Tully & Trentham 2008). The median and mean projected separations from M81 for early types within the CFHT survey region are 122 and 133 kpc (149 and 162 kpc statistically deprojected), while the median and mean for late types are 158 and 169 kpc (193 and 206 kpc deprojected). Beyond the CFHT survey region, all known galaxies associated with the M81 Group except KKH57 are late types. In the common picture, minor galaxies that have made multiple crossings within a group halo have lost their gas through tidal disruption, stripping, or starvation. The outer extent of their distribution roughly coincides with the radius of "second turnaround" (Tully 2010), which is a direct function of the mass of the parent halo. The gas-bearing systems, by contrast, are likely more recent arrivals. They may be on first infall or they may have high orbital angular momentum that has kept them from harm's way.
The apparent flattening of the distribution of early types, although not overwhelmingly convincing, is given credence by similar phenomena seen more locally. The most remarkable case to date has been discussed by Ibata et al. (2013). Half of the small companions to M31 lie in a very thin (±13 kpc) disk with coherent kinematic properties. This disk is askew from the supergalactic plane but oriented such that the Milky Way lies in the same plane. Meanwhile most of the early-type companions to the Milky Way appear to lie in a plane (Lynden-Bell 1976; Metz et al. 2008; Pawlowski et al. 2012). This plane is essentially orthogonal to the supergalactic plane although the long axis is aligned with the long axis of the Local Sheet (Tully et al. 2008), i.e., toward the Virgo Cluster. The past histories of these planes and two other apparent planes of Local Group satellites are discussed by Shaya & Tully (2013). In review, in the few instances around nearby major galaxies where we have information, in every case there is evidence that gas-poor companions lie in flattened distributions.
3.3. Structural Properties of the New Members
To determine centroids of the new objects, we used the geometric mean of the distribution of the resolved RGB stars (or MS stars in the case of d0959+68) in the galaxy field using the F814W ACS/WFPC2 data. Ellipticity and position angle around these centroids were then derived from second moments (Secker & Harris 1997).
To obtain structural parameter measurements for each galaxy observed with ACS, we perform stellar surface density profile fitting. Stellar number counts were extracted in successive elliptical apertures around each galaxy out to a radius of 40 arcsec. This was truncated if counts exhibited a significant increase in slope, chosen empirically to be >30%, attributed to contamination by an excess of field stars. The central measurement was also discarded. Aperture sizes for each galaxy depended on galaxy stellar density and were optimized to contain statistically significant counts over the background while also maintaining enough apertures to perform the fitting. Foreground contamination was estimated in these same sized apertures using stellar detections in the other ACS chip, and a mean foreground stellar count density was determined for each galaxy. This was then subtracted from the galaxy counts. For larger galaxies, the stellar component may extend over the entire ACS field of view, and thus this background correction may be a slight over-correction. The effect of this would be to produce size measurements that are too small, and indeed for larger galaxies, these size measurements are almost certainly underestimates. Smaller galaxies are less likely to extend very far onto the other chip. However, these galaxies are more likely to suffer from statistical variance affecting the low number counts.
We then fit both the differential count density with a Sersic function and the curve of growth with a cumulative Sersic function. The generalized Sersic function is defined as

where n is the Sersic parameter. For n = 1, this reduces to an exponential profile which usually provides a good fit for disk and dwarf galaxies, and for n = 4.0 becomes a de Vaucouleurs profile. The cumulative Sersic function is then

where γ[a, x] is the Incomplete Gamma function (Jerjen 1995),

The fitting of this nonlinear function to the data was done using a Levenberg–Marquard algorithm (Press et al. 1992) which performs a χ2 minimization that implements an inverse-Hessian method far from the minimum and switches to a steepest decent method as the minimum is approached. In Figures 29–34, we display both curve of growth and count density profile fits. Parameters were extracted from the best of these two fits for the six galaxies imaged with ACS. WFPC2 fields are so small that even the smaller galaxies fill the field and it is not possible to obtain a good estimate of the foreground contamination. For these galaxies, we therefore defer to the MegaCam size measurements from Paper 1.

Figure 29. Surface brightness profile fit with a Sersic function for d1012+64 star counts. Both the stellar count curve of growth and differential count density plots are shown with best fits to the profiles overlaid. Stellar counts in the vicinity of the dwarf galaxy are shown as asterisks, foreground counts (as measured further from the object centroid, see the text) as crosses, and subtracted stellar counts corrected for foreground contamination as points. An average background level, shown by the solid black line, is used for the differential count correction. Solid curves are the best-fit Sersic function fits to the data. The best fit for the curve of growth is also shown in the differential count density plot as the dashed red line. A stellar density contour plot is shown in the bottom panel. Black contour lines indicate RGB stellar density with 0.32 star arcsec−2 spacing, blue contours represent main sequence stars. The size of the red ellipse corresponds to the effective radius.
Download figure:
Standard image High-resolution image
Figure 30. Surface brightness profile fit with a Sersic function for d0944+71 star counts; symbols as in Figure 29. Contour lines in the bottom panel indicate RGB stellar density with 0.32 star arcsec−2 spacing.
Download figure:
Standard image High-resolution image
Figure 31. Surface brightness profile fit with a Sersic function for d0939+71 star counts; symbols as in Figure 29. Contour lines in the bottom panel indicate RGB stellar density with 0.12 star arcsec−2 spacing.
Download figure:
Standard image High-resolution image
Figure 32. Surface brightness profile fit with a Sersic function for d0944+69 star counts; symbols as in Figure 29. Contour lines in the bottom panel indicate RGB stellar density with 0.08 star arcsec−2 spacing.
Download figure:
Standard image High-resolution image
Figure 33. Surface brightness profile fit with a Sersic function for d1015+69 star counts; symbols as in Figure 29. Contour lines in the bottom panel indicate RGB stellar density with 0.12 star arcsec−2 spacing.
Download figure:
Standard image High-resolution image
Figure 34. Surface brightness profile fit with a Sersic function for d0959+68 star counts; symbols as in Figure 29. Contour lines in the bottom panel indicate main-sequence stellar density with 0.08 star arcsec−2 spacing. The clumpy structure of separate star-forming knots is apparent.
Download figure:
Standard image High-resolution imageFrom these fits we directly obtain scale length and profile type (Sersic index n), where scale length in the generalized Sersic function is directly related to the half-light or effective radius through

with the approximation bn = 0.868n − 0.142 (Caon et al. 1993). This assumes that the mean brightness of the stars does not vary as a function of radius. It further assumes that we can use counts in the opposing chip as an approximation for the foreground correction. For the larger galaxies, where we may be over-correcting for this affect, we find that if no background correction is applied, d1012+64 and d0944+71 would be 1 and 2% larger, respectively. Results are listed in Table 4. In Figures 29–34, we also display contour plots of these galaxies on which we overlay ellipses with shapes and sizes corresponding to the measured PA, ellipticity, and effective radius for each galaxy.
Table 4. Structural Properties of M81 Group Members
| Galaxy | Cam |  CFHTa CFHTa |
HSTb |
PACFHTa | PAHSTb | α | δc | Re, CFHTd | Re, CFHT | nCFHT | Re, HSTe | Re, HST | nHST |
|---|---|---|---|---|---|---|---|---|---|---|---|---|---|
| (J2000.0) | (J2000.0) | (arcsec) | (kpc) | (arcsec) | (kpc) | ||||||||
| d0939+71 | A | 0.05 | 0.15 | −80.9 | 3.1 | 9:39:16.01 | 71:18:41.00 | 15.3 | 0.27 | 0.66 | 8.9 ± 0.9 | 0.16 ± 0.02 | 0.75 |
| d0944+69 | A | 0.09 | 0.04 | −9.7 | 34.3 | 9:44:22.49 | 69:12:37.94 | 4.9 | 0.09 | 0.78 | 7.2 ± 1.3 | 0.13 ± 0.05 | 1.28 |
| d0944+71 | A | 0.20 | 0.11 | −27.4 | 3.6 | 9:44:34.37 | 71:28:55.60 | 18.3 | 0.30 | 0.61 | 21.4 ± 0.4 | 0.35 ± 0.02 | 0.67 |
| d0959+68 | A | 0.10 | 0.22 | 35.1 | 73.5 | 9:59:34.90 | 68:39:25.78 | 26.6 | 0.48f | 0.21 | 20.8 ± 2.8 | 0.37 ± 0.08f | 0.34 |
| d1012+64 | A | 0.15 | 0.14 | 17.0 | 4.4 | 10:12:48.41 | 64:06:26.21 | 13.9 | 0.25 | 0.88 | 14.9 ± 0.8 | 0.31 ± 0.02 | 0.67 |
| d1015+69 | A | 0.07 | 0.17 | −49.7 | −41.0 | 10:15:06.89 | 69:02:13.81 | 8.5 | 0.16 | 0.68 | 9.6 ± 1.6 | 0.18 ± 0.05 | 0.99 |
| d0926+70 | W | 0.18 | 0.26 | −23.9 | 0.3 | 9:26:27.94 | 70:30:18.79 | 14.3 | 0.24 | 0.42 | |||
| d0934+70 | W | 0.07 | 0.15 | 63.5 | −82.9 | 9:34:03.22 | 70:12:58.32 | 15.3 | 0.22 | 0.42 | |||
| d0955+70 | W | 0.04 | 0.08 | 86.8 | 84.8 | 9:55:14.14 | 70:24:25.96 | 18.6 | 0.31 | 0.61 | |||
| d0958+66 | W | 0.36 | 0.23 | −6.9 | −7.5 | 9:58:48.74 | 66:50:57.34 | 11.6 | 0.22 | 0.71 | |||
| d1006+67 | W | 0.05 | 0.17 | 86.1 | 50.2 | 10:06:46.80 | 67:11:59.78 | 18.1 | 0.32 | 0.44 | |||
| d1014+69 | W | 0.01 | 0.08 | −8.9 | −34.6 | 10:14:55.80 | 68:45:29.71 | 19.7 | 0.37 | 0.29 | |||
| d1028+70 | W | 0.20 | 0.20 | −54.8 | −67.0 | 10:28:39.98 | 70:13:59.84 | 13.4 | 0.25 | 0.88 | |||
| d1041+70 | W | 0.18 | 0.28 | 26.0 | 26.0 | 10:41:18.14 | 70:09:13.75 | 10.9 | 0.19 | 0.30 |
Notes. aMeasurements based on the second moments of the light distribution in MegaCam r' imaging (Chiboucas et al. 2009), including both resolved and unresolved components. bMeasurements based on the second moments of the distribution of resolved RGB stars only. cCentroid based on the resolved RGB population in HST imaging. dFrom integrated Sersic profile fits to curves of growth in MegaCam r' imaging (Chiboucas et al. 2009). Values listed are the geometric mean of the semimajor and semiminor axes. eBased on Sersic profile fits to number counts in HST F814W-band imaging of resolved stars likely to be galaxy members. This assumes the mean brightness of stars is independent of radius, as expected for RGB stars. Measurements are for data taken with ACS only. Radii listed are the geometric mean of the major and minor axes. fFor D = 3.69 Mpc. Actual TRGB measured distance is 4.2 Mpc.
Download table as: ASCIITypeset image
As we found with the CFHT imaging, the majority of the galaxies are best fit with Sersic index n < 1.0. It was determined that the low n fits were primarily driven by large cores, typical of dwarf galaxies, whereas in the outer radii, the surface brightness profile tends to drop exponentially.
For d0959+68, we fit only the blue stellar component which we take to be the tidal dwarf (see Section 3.5.5). However, these young stars are found in star-forming clumps, and the stellar surface density is not well fit with a Sersic profile. This is true in the case of the measurement made with CFHT imaging as well.
To estimate uncertainties in the size measurement, we repeat the process, using different regions of the images for the foreground correction. The 1σ uncertainties quoted in the table come from the variance in size measurements from a total of 20 profile fits. As can be seen in Table 4, the uncertainties are large for the fainter dwarfs, reaching as high as 12.5% in apparent size for the smallest dwarf d0944+69 (or 33% for physical size when including distance uncertainties). The largest and best populated objects observed with ACS, d0944+71 and d1012+64, have much smaller 6% uncertainties in physical size.
Differences from CFHT structural measurements can be attributed to large uncertainties in measurements for faint, low surface brightness objects due to the shallow depth of CFHT/MegaCam imaging, contamination by non-member stars in the CFHT imaging data, uncertainties in the foreground correction for ACS data and small size of the HST fields, and the different methods used. In the case of CFHT imaging data, we used the low surface brightness light profile, just visible above the sky in most cases, while for HST imaging, we use the distribution of individual stars with colors and brightnesses corresponding to the RGB. Shape measurements are also expected to differ since measurements from CFHT imaging were based on the light distribution and will be strongly affected by brighter sources including foreground stars and luminous blue MS stars, while the HST measurements are based on the RGB star counts (with some amount of foreground contamination), each weighted equally.
In Figure 35, we plot  versus log Re for the newly confirmed members with late and early types distinguished by color, along with previously known M81 Group members. Points are based on the MegaCam imaging for which we have size and magnitude measurements for all M81 members within the survey region. The new BCDs are seen as the high surface brightness objects at magnitudes similar to previously known galaxies while the majority of the new detections lie at magnitudes fainter than
  . A surface brightness limit <27 mag arcsec−2 for all new detections is apparent. Also shown in the plot are size measurements based on the ACS imaging for five galaxies. These are shown as crosses at the corresponding r' magnitude. The points are seen to shift slightly although insignificantly in most cases. Only for our smallest dwarf d0944+69 is the shift noticeably large. The two dashed vertical lines indicate the region of parameter space where few star clusters and galaxies tend to be found. The CFHT/MegaCam imaging measurement places d0944+69 within this gap while the ACS measurement inflates it to well within the typical size range for galaxies.

Figure 35. Total r' magnitude vs. size for the M81 dwarfs, color coded by galaxy type. Newly confirmed members from this work are shown as blue squares (late type) and red circles (early type), previously known M81 members are denoted by cyan squares and orange circles (late and early types, respectively). Sizes and magnitudes are determined from our original CFHT/MegaCam imaging. New size measurements from our ACS data are also included for five galaxies as colored asterisks. The tidal dwarf, d0959+68, is absent since the size measurement is highly uncertain. Also included are Local Group dwarf galaxies (open circles and squares represent early and late types, respectively) and members of the Hydra and Centaurus clusters (crosses). See the text. The rough locations of globular clusters and Fornax UCDs on this plane are shown. Few objects are known which fall within the size gap region between globular clusters and galaxies represented here by the two dashed lines. Lines of constant effective surface brightness are also displayed.
Download figure:
Standard image High-resolution image3.4. Total Magnitudes of the New Members
Measuring the brightness of these galaxies from the HST data based on the diffuse resolved stellar populations is not straightforward. For WFPC2 data, only ∼2 mag are visible below the TRGB, with incompleteness and increased photometric errors setting in before the detection limit. ACS data are not much improved for this purpose, reaching only ∼3 mag below the TRGB. In addition, the WFPC2 fields are too small to fully contain the full spatial extent of the galaxies, and foreground contamination is not, in many cases, easily determined. This is true for the larger galaxies imaged with ACS as well. Nevertheless, we attempt to determine absolute F814W-band (I) magnitudes for these galaxies using the following method. For dSphs with pure old stellar populations, we use Padova model stellar LFs with age 12.5 Gyr and metallicity determined from the color of the RGB based on isochrones. Details on the models used for the LFs and isochrones are provided in Section 3.5. We assume these objects have single stellar populations and that the models provide a good match to the data. We then fit the observed RGB LF with a power law. The RGB slope is typically ∼0.3 but we allow it to range between 0.25 and 0.35 although the models permit a slightly smaller range, 0.3 ± 0.025. Integrating over this fitted LF from the TRGB down to the base of the RGB, we obtain an estimate of the total magnitude of the RGB population. Using the model LF, we then determine the fraction of total flux that is in the MS and horizontal branch versus RGB stars and apply this correction to the RGB magnitude. Finally, we make a correction for the fraction of the galaxy that falls off the detector. This method relies on being able to determine the slope of the RGB LF, but sparse RGBs extending only 1.5–2 magnitudes below the tip in the case of WFPC2 data and contamination from foreground stars, cause poor fits. For WFPC2 data, we therefore simply assume a slope of 0.3, as suggested by the models. The largest uncertainties in the total magnitude come from the uncertainties in power-law slope and area correction and together are typically 0.4 mag for ACS data and 0.6 mag for observations with WFPC2. The effect of using different metallicity and age models for an assumed old (>4 Gyr) single stellar population is less than ±0.1 mag.
For objects with multiple or younger populations (see Section 3.5) we additionally include these estimated contributions to the total magnitude. For d0959+68, we only include the contribution for young MS stars under the assumption that this component constitutes the tidal dwarf and scale a model LF with an age of 30 Myr with Z = 0.008 to the observed flux brightward of MF814W = −2 to estimate the total flux. Objects with obvious multiple components are more challenging and we only provide very rough estimates for these by assuming the composite of 2–3 discrete populations. For d0926+70 we use a model with a single old 12.5 Gyr stellar population with Z = 0.001, under the assumption that any younger population present will contribute negligibly to the total magnitude. For the BCDs d1012+64 and d1028+70, we assume the populations are a composite of an old 12.5 Gyr stellar population with Z = 0.0015 and 0.001, respectively, and a young 40 Myr population with Z = 0.008 and 0.003, respectively. In these cases, the contribution from the young component is only 0.1 mag. The intermediate-aged population of d0958+66 cannot be ignored. We therefore factor in missing flux below the detection limit for an assumed three discrete populations: 12.5 Gyr with Z = 0.0008, 1.5 Gyr with Z = 0.002, and 60 Myr with Z = 0.004. The intermediate-age model is scaled in a similar way as is done for the young population using the total flux of visible AGB stars brightward of the RGB. The young and intermediate stars here contribute 0.3 mag to the total based on these models with a model-dependent uncertainty of less than 0.1 mag. These estimated total F814W magnitudes are listed in Table 2.
3.5. Stellar Populations of the New Members
We investigate the stellar populations and evolutionary histories of these confirmed dwarf galaxies. Attempts were made to perform stellar evolution synthesis on the most populated objects observed with ACS. However, with the bright limiting depth of the observations providing access to only the brightest RGB and AGB and handful of upper blue MS stars, along with the degeneracy between age and metallicity at the level of the RGB, uncertainties proved to be very large. Because of this we prefer to keep the discussion more general until deeper data are acquired. We therefore instead use isochrones, overlaying model isochrones on the CMDs for each galaxy in order to determine the plausible range in ages and metallicities of the stellar populations. Padova isochrones (Marigo et al. 2008; Girardi et al. 2008) are used, which are transformed directly on the ACS/WFC and WFPC2 filter systems. From the web interface form, we chose bolometric corrections from Loidl et al. (2001), circumstellar dust calculations as in Groenewegen (2006), and a Chabrier lognormal IMF (Chabrier 2001). We also chose detailed AGB tracks from Marigo & Girardi (2007). Padova isochrones were chosen over other models largely due to the fact that they include stellar isochrones down to very young ages, and several of our galaxies show evidence for young MS populations. Comparisons using Dartmouth (Dotter et al. 2008) and Basti (Pietrinferni et al. 2004) isochrones found these to be systematically more metal poor than the Padova isochrones. For internal consistency, we therefore only include Padova isochrones in this paper.
For old stellar populations, the color of the RGB is more greatly affected by metallicity than age. In Figures 17–25 we investigate the old stellar population by overlaying isochrones extending up to the RGB phase for a constant 12.5 Gyr age, with metallicities Z = 0.0001, 0.001, 0.002, 0.004, 0.01. For many of the galaxies, the CMDs are well described by a pure old stellar population without any indication of intermediate-age AGB stars or younger MS and blue supergiant stars. The large spread in the RGB sequence due to photometric uncertainties makes it difficult to constrain the metallicities. For WFPC2 observed galaxies, because of photometric uncertainties the old RGB stars can be described by a wide range of metallicities typically between 0.0001 < Z < 0.002. Since the photometric errors for the ACS data are much smaller, it is possible to put tighter constraints on the metallicity of the old stellar population. We find for these galaxies that the majority of RGB stars tend to fall between 0.0001 < Z < 0.001 or between 0.001 < Z < 0.002.
We display the RGB metallicity Z versus total r' magnitude for our sample of new M81 dwarfs in Figure 36. The bars along the Z axis are not standard uncertainties, but rather the metallicity of the isochrones having assumed age 12.5 Gyr and colors within ±1σ of the mean RGB color at F814W = 24.5. The photometric uncertainties are expected to produce most of the observed spread in these RGBs, although in a couple cases a width slightly larger than can be accounted for by photometric uncertainties (d1012+64 and d0959+68) indicates possible intrinsic broadening and a real metallicity spread. The metallicity ranges are provided in Table 5. For M81 galaxies not part of our HST follow-up, we use ACS data from the ANGST survey (Dalcanton et al. 2009) taken in similar passbands and reaching about 1 mag deeper. Using the same method we estimate the allowed metallicity range of the RGB for these galaxies. Early- and late-type galaxies are denoted by color, and as has been noted previously (e.g., Mateo 1998), separate relations are found for galaxies that are still forming stars and for those that are not, offset in the sense that late-type galaxies are more metal poor at a given luminosity. Given the large uncertainties, the differences are not significant in our data.

Figure 36. Metallicity of the RGB as determined from isochrones (see the text) vs. total r' magnitude for M81 dwarfs. Magnitudes were measured from our original MegaCam survey data. Error bars are supplied for magnitude measurement uncertainties. Bars along the y-axis denote the range of metallicity spanned by ±1σ of the photometric uncertainties in color. Much of the spread in the RGB is due to photometric uncertainties, although part of this range may be intrinsic and due to multiple stellar populations with a range of ages and metallicities. For M81 galaxies not part of our HST follow-up, we use the data from the ANGST survey (Dalcanton et al. 2009) to estimate metallicity. Excluding measurements derived from WFPC2 data which have significantly larger photometric uncertainties, best fit relations are shown for the early- and late-type galaxies.
Download figure:
Standard image High-resolution imageTable 5. Summary of Stellar Populations
| Name | Instr. |  |
Re | Type | Age Young | Age Int. | AGB/RGBa | ZRGBb | Notesc |
|---|---|---|---|---|---|---|---|---|---|
| (kpc) | (Myr) | AGB (Gyr) | (Gyr) | ||||||
| d1012+64 | A | −13.3 | 0.25 | BCD | <60 | 0.5–4 | 5–8 | 0.0004–0.0018 | MH i = 1.04 × 10⁶ M☉, vr = 190 km s−1 |
| d0958+66 | W | −13.2 | 0.22 | BCD | ⩾60 | 0.5–4 | ∼3 | 0.0001–0.003 | MH i = 0.73 × 10⁶ M☉, vr = 90 km s−1 |
| d1028+70 | W | −12.4 | 0.25 | BCD | <60 | 1–4 | 5–9 | 0.0001–0.0023 | MH i = 1.3 × 10⁶ M☉, vr = −69 km s−1 |
| d0944+71 | A | −12.4 | 0.30 | dSph | (⩾150) | (∼2) | old | 0.0005–0.002 | MH i < 0.31 × 10⁶ M☉ |
| d0959+68 | A | −11.9 | 0.48 | dI/tdl | <80 | 0.0001–0.0035 | |||
| d0926+70 | W | −9.8 | 0.24 | dI/dSph | (⩾100) | ⩾0.5 | 4–7 | 0.0001–0.0023 | MH i < 0.31 × 10⁶ M☉ |
| d0955+70 | W | −9.8 | 0.31 | dSph | 0.0001–0.003 | ||||
| d1006+67 | W | −9.8 | 0.32 | dSph | 0.0004–0.004 | ||||
| d0934+70 | W | −9.4 | 0.22 | dSph | (∼1) | 0.0001–0.004 | |||
| d0939+71 | A | −9.4 | 0.27 | dSph | 0.0002–0.001 | ||||
| d1014+68 | W | −9.4 | 0.37 | dSph | (∼1) | 0.0001–0.003 | |||
| d1041+70 | W | −9.3 | 0.19 | dSph | 0.0001–0.003 | ||||
| d1015+69 | A | −8.8 | 0.16 | dSph | 0.0001–0.001 | ||||
| d0944+69 | A | −6.8 | 0.09 | dSph | 0.0003–0.0018 |
Notes. Values listed for ages and metallicities are approximate ranges determined from Padova model isochrones; see the text. Prominent young or intermediate populations are denoted in boldface, while more tentative identifications are listed in parentheses. aComposite age estimate for the older populations; see the text. These estimates are best used as relative age indicators. bThe range of metallicities which span the ±1σ width of the RGB, assuming a 12.5 Gyr age for the old stellar population. cH i measurements taken from Roychowdhury et al. (2012).
Download table as: ASCIITypeset image
To assess ages, we can again use isochrones to investigate the existence of young, intermediate, and old populations, and can also compare the relative fractions of different populations. The older stellar populations (>1 Gyr) visible in these CMDs are formed by RGB and AGB stars. Since AGB stars evolve faster than RGB stars, the ratio of the two populations provides information about the ages of the older stars. Following Jacobs et al. (2011), we take the ratio of RGB and AGB stars as stars 2 mag below and 2 mag above the TRGB, respectively, which gives a crude estimate of the ratio of intermediate to old stars. We use the same color cuts for the ACS data that they use to extract counts from simulated CMDs for a range of metallicities and ages and compare our results to their simulations for single stellar populations as shown in Figure 37. For our WFPC2 data, due to the larger uncertainties, we broaden the color constraints defining the RGB by a factor of 1.5, consistent with the increased magnitude errors. Because the model values were extracted using older Bertelli et al. (1994) and Girardi et al. (2000) evolutionary tracks while we use more recent models to estimate metallicities, and as these are strictly model estimates, the reader is cautioned against directly reading off ages from the plot based on the measured population ratio and metallicity. However, we expect the trends to be valid and thus the ratio to be useful for estimating the relative ages of our galaxies. Of course, these results also assume a single age for the old stellar population, whereas some of these objects may have hosted continual or at least multiple bursts of star formation.

Figure 37. Ratio of the number of AGB to RGB stars (within the upper 2 mag of the RGB) vs. age in 2 Gyr bins (the horizontal offset of the symbols within bins is for clarity only). The ratio is omitted for the most recent age bins because other populations provide stronger constraints on the SFH as well as add complexity to the problem of defining an RGB or AGB star on the simulated CMDs.
Download figure:
Standard image High-resolution image3.5.1. BCDs: d1012+64, d0958+66, and d1028+70
Three of the new objects were considered to be BCD galaxies in Paper 1: d0958+66, d1012+64, and d1028+70. All three are compact in size with effective radii 220–250 pc and contain significant numbers of blue stars. For the most part these galaxies are found toward the periphery of the second turnaround radius of the group, as can be seen in the distribution maps in Figure 26, although d0958+66 does lie closer to the core region with a physical separation from M81 of only 180 kpc.
One of these galaxies, d1012+64, has deeper imaging observed with ACS, while the other two were observed with WFPC2 and only reach ∼1.5 mag below the TRGB. Originally detected in the Kiso Survey for UV excess galaxies, d0958+66 was previously classified as a spiral galaxy while d1012+64 is also cataloged as UGC 5497 and was considered a "diffuse" object. Distances found here confirm their M81 Group dwarf galaxy status.
The CMDs shown here corroborate our original classification of BCD for these objects. All three host significant young populations in addition to well developed RGBs. MS (F606W − F814W < 0), blue loop, and red supergiant stars are visible, indicating very recent or ongoing star formation. We find 24, 56, and 40 stars with colors bluer than F606W − F814W < 0.6 and magnitudes brighter than the TRGB, indicative of a young population, for d1012+64, d0958+66, and d1028+70, respectively, whereas all dSph and transition type objects exhibit no such stars in the CMD with the exception of d1014+68, which has two. Isochrones with a range of ages and metallicities are overlaid in Figures 17 and 18.
We estimate the metallicity of the old population using the overlaid isochrones assuming the RGB is defined by old stars with ages of ∼12.5 Gyr. For d1012+64 we find that isochrones with Z =0.001–0.0015 match the RGB well. However, lower ages or metallicities in the range 0.0004 < Z < 0.0018 are possible. For a younger assumed 7 Gyr age, tracks with 0.001 < Z < 0.004 would also match the RGB. The metallicities for the other two BCDs are even less well constrained due to photometric measurement errors and the resulting broadness of the RGB. However, we find a metallicity of ∼0.001 (0.05 Z☉) for both of these with an allowed range of 0.0001 < Z < 0.003 assuming 12.5 Gyr ages, slightly more metal poor than d1012+64. Roychowdhury et al. (2012) estimate metallicities for these galaxies using an L–Z relation for BCDs, finding Z ∼0.05 Z☉ for all three. Metallicities are therefore fully consistent with those expected for their luminosities. As d1012+64 is the brightest of this sample, it is therefore not surprising that it also appears to have the highest metallicity. The young population in d1012+64 is best described with isochrones having Z =0.004–0.008, while for the other two BCDs, more metal-poor isochrones with Z =0.002–0.004 yield better matches to the data. In Paper 1, from longslit spectroscopy and a comparison of [N ii] λ6584 and Hα lines, we found an upper limit of Z < 0.0057 for the ionized gas in regions around young stars in d0958+66 and d1028+70, again consistent with these results.
The width of the RGB provides information about the number and extent of star formation episodes. In particular, the width of the RGB for d1012+64 is visibly larger than for most other objects observed with ACS/WFC (see Figure 8) but photometric uncertainties here are also larger due to effects of greater crowding. The measured intrinsic width is slightly broader than expected from the magnitude errors as determined from false star tests, but not significantly so. In the other two cases, the width of the RGB is consistent with the WFPC2 photometric uncertainties. This therefore provides no conclusive proof for multiple stellar populations with intermediate and old ages. However, in such cases where old RGB, intermediate-aged AGB, and young MS stars are all present, clearly more than one period of star formation has occurred.
In all three cases isochrones for young populations with ages 20–200 Myr provide acceptable matches to the bluer points in the data. Even younger ages may be possible for d1012+64 and d1028+70. For both d1012+64 and d1028+70, star formation likely occurred at least as recently as 60 Myr ago, while for d0958+66, the CMD exhibits only a weak scatter of such very blue stars. The majority of young stars in this object fall redward of F606W − F814W = 0, and may indicate that the most recent episode of star formation took place ⩾60 Myr ago. For d0958+66 and d1028+70, longslit spectra show post starburst signatures with strong Balmer absorption. In addition, Hα emission is found in both galaxies (see Paper 1).
From interferometric radio observations with the Giant Meterwave Radio Telescope (GMRT), Roychowdhury et al. (2012) detected H i in all three of these BCDs. H i masses were determined to be ∼1.7–3.5 × 10⁶ M☉ for these, with d1012+64 having the lowest mass and d1028+70 having the highest. Based on Hα and FUV observations, they also determined star formation rates ∼10−4 M☉ yr−1, making these some of the lowest-mass star-forming galaxies known. Hα fluxes, indicative of instantaneous star formation, were found to be very low and capable of being produced by a single O star. The stronger FUV fluxes they measure from GALEX data trace recent star formation within the past ∼108 yr, consistent with the results based on the CMDs. For d1012+64, they also find evidence for possible H i outflows.
The location of red supergiant stars in the CMD is strongly affected by metallicity, thereby constraining the metallicities of the young populations in these galaxies. For d1012+64, we compare isochrones to helium-burning red supergiant stars just blueward of F606W − F814W = 1 and find that isochrones with metallicity Z >0.004 describe the data well. For d0958+66, we find 0.003 < Z < 0.008 with a good match to the data for Z = 0.004, while for d1028+70, 0.002 < Z < 0.004 best describe the data. As was found from the color of the RGB, d1012+64 appears to be the most metal-rich of the BCDs.
A significant AGB component also visible in these plots above the RGB may be evidence for an intermediate-aged population and may partially contaminate the RGB sequence of old stars. From visual comparison of the BCD CMDs, the largest AGB population is seen in d0958+66. AGB tracks with ages between 500 Myr and 4 Gyr approximately bracket the AGB stars in all three objects assuming metallicities of 0.001 < Z < 0.003.
From the ratio of AGB/RGB stars, we investigate the ages of the old stellar population under the assumption of an initial dominant star formation episode. For BCD d1012+64, we find a ratio of AGB/ RGB stars in the core region of 0.06 while over the full extent of the chip the ratio is slightly lower, at 0.05. From Figure 37, we find that this corresponds very roughly to an age of around 5–8 Gyr in the core for −1.5 < [Fe/H] < −1 (based on the color of the RGB) and 8–10 Gyr when including the galaxy outskirts. The radial spread in age over the galaxy is not surprising since we know that very recent star formation has only occurred in the central core based on the location of the blue stars in this galaxy, as seen in Figure 16. For BCD d1028+70, we find a similar but slightly higher ratio of 0.067 which, with metallicity between −1.78 < [Fe/H] < −1.0, corresponds to an age of about 5–9 Gyr for the old population, while for BCD d0958+66, we obtain a much higher ratio of 0.19, suggesting a major period of star formation more recently than 3 Gyr ago.
Spatial distributions (Figures 12, 13, and 16) of the different stellar populations can also be used to probe the stellar evolution. For these three galaxies with significant populations of RGB, AGB, and MS/blue He-burning stars, we find that AGB stars generally follow approximately the same distribution as RGB stars although are more concentrated toward the core in d1012+64 while the young stellar component for all three is found to be concentrated toward the core in each. In the case of d0958+66, the concentration appears to be extended along the major axis of the galaxy, while in d1028+70, the blue stars are centrally concentrated. For d1012+64, the blue stars are clustered in the center of the galaxy, but are elongated along the minor axis of the galaxy. This can be seen in a contour plot, Figure 29, where black contours correspond to the RGB component while blue contours represent the younger stars. Roychowdhury et al. (2012) display FUV contours for these objects which, as one would expect, coincide with our blue population contours and for d1012+64 are also elongated along the minor axis and concentrated near the core of the galaxy.
To investigate whether star formation episodes may have propagated through the galaxy over long timescales, we compared CMDs for each BCD as a function of distance from the center, along both the minor and major axes. We find no significant changes in the location of the RGB, and therefore in metallicity or age, further from the core region. The primary differences are a slightly broader RGB for stars near the core (due in part to larger photometric errors where crowding is greater and to the presence of multiple stellar populations) and the gradual disappearance of younger stars further from the core, consistent with the picture of a constricting star formation region confined to the galaxy cores. Recent star formation limited to the central core for all three galaxies suggests the H i gas is only dense enough for star formation in the deepest part of the potential well of these small galaxies.
3.5.2. dI/dSph Transition: d0926+70
This galaxy was considered a dI in our original discovery paper. In the WFPC2 imaging, it is found to contain several blue stars clustered near the galaxy centroid, although perhaps slightly off-center (Figure 12). This is difficult to determine as the object is not entirely imaged within the WFPC2 field, and the shape of the galaxy appears to be slightly extended and irregular as well.
Plotting stellar detections on the CMD, Figure 19, we find a handful of stars in this galaxy have (F606W − F814W)○ ∼ 0.0. There are also a number of stars brightward of the RGB. We include tracks for young stellar populations having age and metallicities 80–500 Myr with Z = 0.0015–0.002, and for intermediate-aged populations with ages and metallicities 1 Gyr with Z = 0.0015 and 4 Gyr with Z = 0.001.
Based on the isochrones we find some evidence for a young population of young blue and red helium-burning stars with ages >100 Myr. It is not clear whether the stars brightward of the RGB truly form an intermediate-aged population or whether they are also part of a fairly young stellar component. RGB stars are consistent with an old metal-poor population having 0.0001 < Z < 0.0023. However, the AGB/RGB ratio is rather high, at 0.08, corresponding to an age of ∼4–7 Gyr. If the dominant population has an age as young as the fraction of AGB stars would suggest, the RGB and most stars brightward of the RGB could potentially be accounted for by an intermediate-aged population with Z ∼0.001. All stellar detections are well represented with metal-poor isochrones. The AGB population is much better described using metal-poor isochrones than slightly more chemically enriched ones and even the young component can be represented with metal-poor isochrones. There is no evidence for significant metal enrichment in this galaxy.
Roychowdhury et al. (2012) observed d0926+70 with the GMRT and did not detect H i to a 3σ upper limit of 0.31 × 10⁶ M☉. It is plausible that the H i mass in this galaxy is simply lower than this, as the starbursting brighter BCDs contain as little H i as 1.7 × 10⁶ M☉. Given the excess of blue stars toward the core of this object, the irregular shape of the galaxy, and the roughly determined young age for the blue stellar component, we consider this object to be a dwarf transition object with properties intermediate between dIs and dSphs. Such objects known in the Local Group include, e.g., Phoenix, LGS3, and Leo T. With an effective radius of 240 pc and brightness MR = −9.7, this is one of the smallest galaxies with recent star formation known. As would be expected for a late-type galaxy, this object does not lie in the core of the group. In the lower panel of Figure 26, it can be seen as the object well separated from other galaxies at supergalactic Cartesian coordinates (2.7, 2.1, 0.006), and with a distance from M81 of 345 kpc.
3.5.3. dSph: d0944+71
The one dSph with a well built up RGB is d0944+71, observed with ACS. Although a few AGB stars are present brightward of the TRGB, the stellar population of d0944+71 is dominated by RGB stars (Figure 20). The RGB itself has a slightly higher metallicity than the other ACS observed dSphs, with the sequence bracketed largely by 0.001 < Z < 0.002 isochrones. No obvious MS is present in the CMD to our limiting magnitude, although we find several very blue stars associated with this galaxy. These exhibit a slight excess and concentration in the core of this galaxy over the scatter of blue stars seen in other ACS fields (see Figure 15), indicating that they are associated with the galaxy. However, from the CMD we find that these are clustered at the faintest magnitudes where photometric uncertainties are largest. If these are young stars, any low-level residual star formation is constrained by isochrones to have occurred ⩾150 Myr ago. AGB stars are sparse, and we find an AGB/RGB ratio of ∼0.02, indicative of a very old population. The few AGB stars present can therefore be accounted for with a strictly old population. The picture from the CMD then is of a dominant, and perhaps exclusively, old population. Blue stars are attributed to either foreground contamination, photometric errors, or very low-level star formation at more recent epochs. Another non-detection in HI, Roychowdhury et al. (2012) find a 3σ upper limit of 0.31 × 10⁶ M☉.
In our original paper, we had considered this galaxy to be a possible dI due to the large stellar population, which included a few visibly brighter stars. Given the lack of a significant young component to the stellar population present in the CMD, we now consider this object to be a dSph even though it does host a scattering of potentially young stars. Interestingly, this object lies at a large distance from the core of the group, ∼335 kpc distant from M81. It is easily seen on the lower panel of Figure 26 well separated from other large galaxies at supergalactic coordinates (2.6, 2.1, 0.1). This large distance may explain the very low level of star formation this galaxy may have undergone perhaps as recently as 150 Myr ago.
3.5.4. Classical and Ultra-faint dSphs
For ACS observed galaxies, we find pure old stellar populations in the very small galaxies d0939+71, d0944+69, and d1015+69. These have poorly populated, but still reasonably well defined RGBs. The only stars present in the CMDs (Figures 21 and 22) are those that could be described by an old red giant population having low metallicity. For d0939+71 and d1015+69, 12.5 Gyr isochrones suggest an RGB metallicity between 0.0001 < Z < 0.001, consistent with an old, single age/metallicity population. The RGB for d0944+69 is very poorly populated, but may have a slightly higher metallicity than these other two galaxies. The isochrones that best bound this RGB have metallicities between 0.0001 < Z < 0.002. This is also our smallest and faintest dwarf at  with size Re = 90 pc (as estimated from r' MegaCam data) or Re = 130 pc and MI = −9.1 (as measured from F814W ACS data), likely within the range of the UFD galaxies (MV > −8.0) being discovered within the Local Group. With no evidence for a younger stellar population, we consider these three galaxies to be non-star-forming, old dSphs. Object d1015+69 was considered a possible dI in our previous paper but is now established to be an early-type dSph.
Galaxies observed with WFPC2 having pure old stellar populations as found from the CMDs (Figure 23) include d0955+70 and d1006+67. These are likely to be metal poor, although the metallicities are poorly constrained due to large photometric uncertainties. Besides the shallow depth of the imaging, the RGBs are poorly populated since these galaxies host very small stellar populations. Three other galaxies observed with WFPC2 (d1041+70, d1014+68, and d0934+70, Figures 24 and 22) also display predominantly old stellar populations although may host a few stars above the TRGB. We find that a 1 Gyr, Z = 0.002 isochrone could explain the handful of AGB stars in d0934+70 coinciding with this track. For d1041+70 and d1014+68, AGB sequences for ages 1 and 4 Gyr with Z = 0.002 approximately bound the few AGB stars in these galaxies. Although there may have been some small amount of star formation as recently as ∼1 Gyr ago, there is no evidence for significant intermediate (or young) populations in any of these aforementioned galaxies. Thus, we also consider these five galaxies to be dSphs.
Object d1041+70 was considered a possible dI in our previous paper but is now determined to be an early-type dSph without any recent star formation. However, the pear shape of this galaxy observed in MegaCam imaging is noted again here (Figure 13). This object is spatially extended along one axis with very few associated stars outside of the main concentration. It appears to be tidally disturbed. Interestingly, this object lies far from M81 and the core of the group. This can be seen as the faint early-type galaxy near the BCDs at positive supergalactic cartesian Z in the 3D maps (Figure 26), and in particular nearest to d1028+70. The distance of d1041+70 from M81 is 265 kpc while the separation from d1028+70 is 122 kpc. We find that the major axis of the galaxy (as projected on the sky) does not, however, point toward either of these galaxies, being ∼65 and 80 deg off from M81 and d1028+70, respectively, in 3D space or 25 and 32 deg off in 2D space.
3.5.5. Tidal Dwarf: d0959+68
The final group member is d0959+68. The CMD for this object (Figure 25) exhibits similar numbers of blue and red stars including an MS, red and blue helium-burning stars, an RGB, and possibly a small population of AGB stars. A young population is clearly present and, based on isochrones, may include stars younger than 60 Myr. Karachentsev et al. (2011) find evidence for star formation within ∼10 Myr through Hα emission and a derived star formation rate of log(SFR [M☉ yr−1]) =−3.77. As this object has a sparse RGB, we conclude that it has not had time to build up a significant RGB. Stars no older than 4 Gyr could make up the bulk of the RGB.
We propose that the RGB that is present more likely consists of older stars in the M81–NGC 3077 bridge which formed originally within one of these galaxies, while the young population is related to recently induced star formation attributed to the interaction between these galaxies. This object was imaged with both WFPC2 and ACS. Both fields are shown in Figure 14 for comparison. The deeper imaging of ACS is apparent with the much greater number of stellar detections. The ACS field exhibits a uniform distribution of red stars, which are more numerous than seen in other ACS fields away from the dwarf galaxy cores, whereas at the location of the targeted object we find a strong concentration of blue stars. While it is possible that the blue stars represent a clump of younger stars within a more extended object, we believe that the very uniform and broad spread of RGB stars indicates that these originate from the tidal stream itself. The blue stars, having then formed recently within the H i stream, constitute the tidal dwarf. It is not known whether there is a large enough mass associated with this object for it to remain a separate (long-lived) bound entity. The TRGB distance for this object of 4.2 ± 0.3 Mpc may be more indicative of the distance to the tidal stream stars than to the tidal dwarf itself.
Table 5 provides a summary of the stellar populations found for each object. This includes the approximate age and metallicity ranges for young, intermediate, or old stellar populations.
4. DISCUSSION
Overall, we find a wide range of properties in these small, faint group members—from dSphs with very old stellar populations, a dI/transition dwarf with intermediate-age, three BCDs forming stars as recently as 20–200 Myr ago, and a tidal dwarf with a presumed pure young stellar population.
In the original surveyed region, there are now a total of 36 galaxies that belong to the M81 Group. These include 4 BCDs (including DDO 82), 8 other late types (including the M81, M82, NGC 3077, and NGC 2976 giants), 19 early-type dwarfs, and 5 tidal dwarfs. The projected distribution and 3D plots in supergalactic Cartesian coordinates are shown in Figure 26. We see evidence for a morphology–density relation—late-type dwarfs (excluding tidal dwarfs) are found with a median physical separation from M81 1.9 times larger than that of early-type dwarfs. Early-type dwarfs reside at a mean distance of 0.21 Mpc from M81 compared with 0.30 Mpc for late-type dwarfs. Distinguishing between BCDs and dIs, we find mean distances of 0.27 and 0.34 Mpc, respectively. Both of these mean distances are outside the second turnaround radius of the M81 Group, 230 kpc. As BCDs are some of the least clustered objects in the universe, and typically found in low density regions, this result is not surprising.
The core of the M81 Group contains three closely interacting galaxies. Yun (1999) mapped out H i tidal streams that connect the three giant galaxies M81, M82, and NGC 3077. From models, they find the time of nearest approach of M82 and NGC 3077 to M81 to be ∼220–280 Myr ago, coinciding with the ages of starbursts in all three galaxies and producing the observed H i streams. This core region is filled with a number of star-forming knots and tidal debris. Amongst this debris and within the streams lie several previously known or suspected tidal dwarfs including Arp's loop (and its brightest portion A0952+69), Garland, HoIX, and BK3N (Karachentsev et al. 2002; Makarova et al. 2002). Davidge (2008) also identified three tidal debris objects within ∼20 kpc of M81 likely to be short-lived structures, and more recently, two other small clumps of star formation were discovered lying along the H i bridge connecting M81 and NGC 3077 (Mouhcine & Ibata 2010; Karachentsev et al. 2011). We now include d0959+68 in this family. This object was originally discovered by Durrell et al. (2004) in a survey for red giant stars around M81. In addition to a very low surface brightness contribution of RGB stars, they identified a knot of young blue stars lying in projection on the southeastern stream connecting M81 and NGC 3077, within a region of high H i density. From isochrone fitting to the CMD populated by these blue stars, they found evidence for star formation in the last 30–70 Myr. Similarly, we also find that isochrones with ages between 30–80 Myr and Z = 0.008 bracket much of the MS. Red and blue supergiant stars found between the MS and RGB may indicate the presence of a population as old as 200–400 Myr, around the timeframe of the expected formation period of the streams.
The Garland, which consists of several knots of star formation spanning 7' × 4', lies in projection near NGC 3077 while BK3N and A0952 lie near M81. Attempts to measure the distances using the TRGB found distances that more likely applied to the major galaxies themselves (Karachentsev et al. 2002). HolmIX, on the other hand, had no identifiable RGB population so distance estimates are based on photometry of the brightest stars. In the 2D distribution of M81 cluster members (Figure 26), it is seen that the tidal dwarfs lie very near to the three giants involved in the tidal interaction, and in projection lie within the H i tidal streams (see Figure 31 in Paper 1). Estimated distances for these objects as found in the literature (Karachentsev et al. 2002) are used in the 3D plot in Figure 26. Given the large uncertainties in the distance measurements for these objects, the 3D positions displayed for the tidal dwarfs should be considered highly uncertain.
The remaining star-forming objects are found toward the periphery of the group. One of these is the dI/dSph transition galaxy, d0926+70. This is one of the smallest known recently star-forming dwarfs, surpassed only by Leo T and Leo P of the Local Group. Although slightly smaller and fainter, it could be said to resemble the Local Group dI/dSph transition objects Phoenix and LGS 3. A study of the star formation history of these two Local Group galaxies (Hidalgo et al. 2011) found that a majority (50%–90%) of the stars in these galaxies formed early in initial episodes of star formation during which there is no evidence of any chemical enrichment. Since that first epoch of star formation, these galaxies have continued to form stars at a very low rate until very recently, with chemical enrichment only occurring at very recent times. Similarly, d0926+70 appears to have had a dominant early period of star formation without significant chemical enrichment and exhibits evidence for later and recent star formation at very low rates based on the presence of a handful of blue and red He-burning stars and possible low-metallicity AGB stars. The total H i gas mass measured for LGS 3 is 2.7 × 10⁵ M☉ (Hidalgo et al. 2011). Roychowdhury et al. (2012) do not detect any H i in d0926+70 to an upper limit of MH i = 3.1 × 10⁵ M☉. As d0926+70 is a smaller and presumably lower-mass galaxy than LGS 3, the non-detection of H i might be expected in this recently star-forming dI/dSph. At a distance of 345 kpc from M81, d0926+70 is outside the second turnaround radius of the group and thus likely has not yet experienced the effects associated with a group environment such as ram pressure stripping, tidal stripping, or strangulation, which would remove the remaining gas supply and shut off star formation. After an early burst of star formation, it seems likely that this galaxy was able to retain enough remaining and recycled gas to carry on with a slow trickle of star formation as the low gas density allowed.
BCDs are generally compact, starbursting dwarf galaxies, although their classification has assumed many definitions. Gil de Paz et al. (2003) have attempted to compile these into a single set of criteria. However, these depend on B, R, and K magnitudes. Other qualifications have required absolute blue magnitudes fainter than MB > −18.15 mag, diameters less than 1 kpc, strong emission lines superposed on a blue continuum (Thuan & Martin 1981), and spectra exhibiting high-excitation emission lines and low Hα luminosities (LHα < 1041 erg s−1; Gallego et al. 1996). Our measurements satisfy many of these criteria (see Roychowdhury et al. 2012 for LHα measurements for these galaxies), although in some respects resemble post-starburst galaxies displaying strong Balmer absorption lines in their spectra. The CMDs shown in this work provide strong evidence for recent star formation with the presence of upper MS stars. In Figure 35, the BCDs are found at the highest surface brightnesses for dwarfs. They are also found just faintward of a boundary separating majority brighter late types from majority fainter early types. Roychowdhury et al. (2012) find Hα and FUV fluxes that indicate star formation within the past 108 yr along with some very low-level instantaneous star formation, in agreement with the CMDs. intermediate-aged AGB stars are also present.
The question remains as to why these objects are undergoing a starbursting phase. The distances of d0958+66, d1028+70, and d1012+64 from M81 are 179, 228, and 337 kpc, respectively. For d1012+64 and d1028+70, this is close to or outside the nominal group second turnaround radius. DDO 82, another M81 Group member with a BCD-like component, is also outside the second turnaround radius at 329 kpc. A fifth object outside our survey region, VII Zw 403, is also considered an isolated BCD in this group. Meanwhile d0958+66 is the one BCD within the 2nd turnaround radius and the one with perhaps the least recent star formation event. As suggested in Paper 1, the excess of 4–5 BCDs within this group may indicate that the termination of star formation is due to processes that are weak in this environment such as ram pressure stripping, or, perhaps more likely, that these galaxies are on first infall orbits and processes such as strangulation which play a role even in such poor groups have yet to act on these galaxies or, in the case of d0958+66, may have recently started to act. With a relative radial velocity with respect to M81 of +90 km s−1 and a distance slightly larger than M81, d0958+66 may have already passed near the center of the group and the interaction with the group potential may have caused the recent cessation of star formation. The next closest BCD to M81, d1028+70, has a relative radial velocity with respect to M81 of −69 km s−1 and a slightly larger distance, perhaps suggesting this object is on first approach.
It may be possible that post-starbursting phase, these objects will fade enough to resemble the M81 dSphs at similar sizes. Using our trick of estimating total magnitudes based on model isochrones and scaling of stellar LFs, and assuming something about the ages and metallicities of various populations within the galaxies, we roughly calculate how much the BCDs would fade if we simply removed all the young and intermediate stars. In the case of d1012+64 and d1028+70, we had only assumed a single old population and single young population. Simply removing the young population would produce only 0.12–0.25 mag of fading in I. For d0958+66 we assumed an additional intermediate-aged population. Removing these as well, we find ∼0.3 mag fading. Star formation in these galaxies of course may have been continuous or have occurred in more than 2–3 bursts so these may be underestimates. Simply removing the contribution of all visible blue and AGB stars from the visible component of each BCD finds 0.2, 0.5, and 0.6 mag dimming for d1012+64, d1028+70, and d0958+66, respectively. For d1028+70, this should be enough to push this galaxy into the surface brightness/size/magnitude range of the brighter dSphs, within the uncertainties (Figure 35). For the other two, at least 1–2 mag of fading would be necessary, although if we have underestimated the contribution of younger sources to the total light of the galaxy this may be possible. A further issue is that ∼2–3 mag dimming would be required to put these objects on the same metallicity–brightness relation (Figure 36) as the dSphs, although given the large scatter in these relations, such significant dimming might not be necessary.
Our brightest new dSph, d0944+71, is quite similar to these BCDs in several respects. In the magnitude–size plane (Figure 35), it is found at similar brightness and size, with a surface brightness only slightly lower than that of the lowest surface brightness BCD, d1028+70. It has an RGB approximate metallicity of Z =0.0015, similar to BCD d1012+64, and has a similar size. Although we can confidently say that this galaxy has a predominantly old stellar population and has not recently formed stars, there are a handful of stellar detections blueward of the red sequence which could belong to a young >150 Myr population and which are found spatially coincident with the central region of the galaxy. Assuming these are real, this galaxy may still produce a frosting of star formation. In addition, this dSph lies at a large distance from the center of the group, at a similar distance as the BCDs. It may be that this object has already undergone a first pass through the group and this is responsible for having halted most star formation.
The other dSphs are all much fainter, by several magnitudes, and have lower surface brightness. These fall within an area of size and magnitude parameter space that previously had been unexplored in the M81 Group due to the difficulty in detecting such faint and small objects. For the most part, these galaxies appear to have pure old populations although a couple display evidence for intermediate-aged AGB stars as well.
The smallest object in our sample, dSph d0944+69, was originally measured in our MegaCam data to have a size of 90 pc, which falls within the 40–100 pc size gap between most dwarf galaxies and globular clusters (Gilmore et al. 2007). This can be seen in Figure 35 as the point much smaller and fainter than any of the other new detections. The size gap region is bounded by two dashed vertical lines, and d0944+69 falls between them, albeit toward the galaxy scale boundary with a 1σ upper limit in size extending above 100 pc. Current measurements using the ACS data and the bright RGB population places the size at 130 pc. This is a factor of 1.4 times larger. Using models and assuming a pure old stellar population, we estimate a total absolute F814W magnitude from the ACS imaging of −9.1. For such old, red objects, V − I ∼ 1.0, suggesting MV ∼ −8.1. If our initial total r' magnitude measurement was increased in the same proportion as the larger ACS size measurement, the expected brightness would increase from  to −7.4. Assuming a color V − R > 0.3 and taking the transformation r' = V − 0.84(V − R) + 0.13 (Fukugita et al. 1996), we find MV > −7.2. This object is therefore similar in magnitude to the brighter UFDs recently discovered in the Local Group.
We cannot say too much about the faintest and smallest dwarfs as the upper RGB is very poorly populated and no other stellar populations appear within the depth of our observations. There is a hint of elongation visible in d1015+69 with ellipticity 0.18 while d0944+69 and d0939+71 both appear to be rounder. With a lack of any younger AGB or MS stars visible in the CMDs we find evidence for pure old stellar populations. The metallicity for d1015+69 and d0939+71 is constrained between Z ∼0.0001 to 0.001, while for d0944+69, it may be ∼0.001. These are therefore metal-poor objects, although not extreme cases.
Compared with the Local Group, we find a larger fraction of late types in M81, including BCDs and tidal dwarfs, types unknown in the Local Group. Around the Milky Way, only the Magellanic dwarfs are not considered dSph. The population around Andromeda is more varied, with a known population comprised of ∼25 dSphs, 1 transition object, 1 dI, 3 dEs, 1 cE, and a low-mass spiral (McConnachie 2012). The excess of the tidal dwarfs and possibly BCDs can perhaps be explained by a dynamically younger and/or strongly interacting system in M81. Across both the M81 and Local groups, brighter dwarfs tend to be dIs while the majority fainter than  are dSph with only a handful of star-forming objects: the three M81 BCDs, several tidal dwarfs, and a few dIs and transition objects including d0926+70, Leo T, Leo P, Phoenix, LGS 3, and Antlia. With the exception of the tidals, these all generally conform to the morphology–density relation. Our surface brightness limit is ∼2 mag arcsec−2 brighter than the limit for objects currently being discovered in the Local Group. Based on the similarities between the groups, we can expect that a large number of faint dSph remain to be discovered around M81.
We revisit the group LF and faint-end slope from our first paper. In Paper 1, we constructed both a differential and cumulative LF for known members, all candidates, and most likely members. We used total magnitudes corrected for light lost in the sky noise assuming objects had surface brightness profiles that could be modeled with Sersic functions and created artificial galaxies to test completeness limits. Galaxy counts were normalized by the areal coverage, which accounted for small gaps in the sky coverage, and were corrected for completeness at faint magnitudes. Use of the cumulative LF was necessary due to the overall small number counts of group members and hence large uncertainties within the magnitude bins. A cumulative Schechter function was fit to the cumulative counts using maximum likelihood techniques with a Poisson estimator. We perform the same operations as in Paper 1 for the final set of 36 galaxies and display these counts along with best cumulative Schechter function fit in Figure 38. The 1σ α − M* error ellipse for the completeness-corrected cumulative counts is shown in Figure 39. It can be seen that the exponential cutoff parameter M* is not at all constrained at the bright end, but the choice of M* will not greatly effect the value of the logarithmic slope parameter α. Results for the faint-end slope are provided in Table 6.

Figure 38. Cumulative luminosity function for the M81 Group, using corrected magnitudes assuming Sersic profiles. Counts are normalized to the area of the survey coverage. Large solid circles include all 36 known members of the M81 Group within the surveyed region. Open circles are counts corrected for completeness. Blue triangles are the previously known members. The hatched region denotes where the survey is incomplete. Schechter function fits to previously known and all members, uncorrected for completeness, are derived only to Mr = −10 (dashed blue and red lines, respectively). The solid line represents the best fit to completeness corrected counts with ±1σ slopes shown as dotted lines.
Download figure:
Standard image High-resolution image
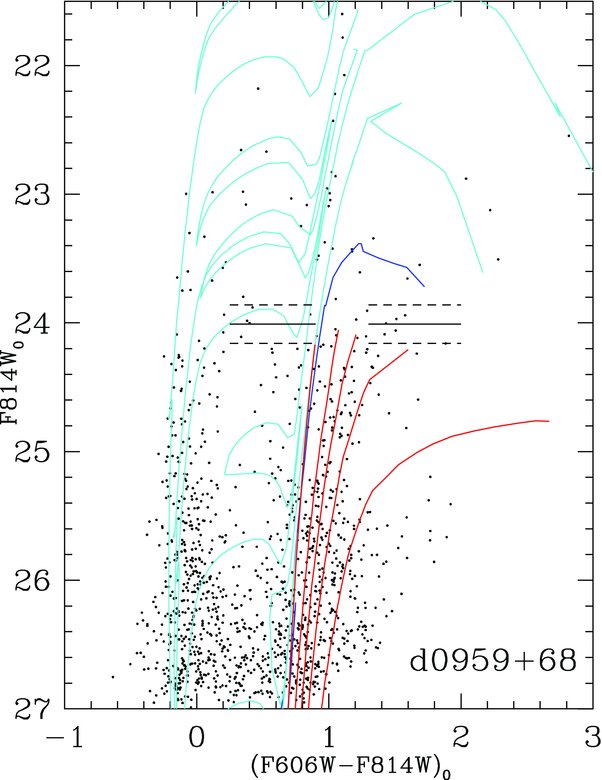
Figure 39. 1σ error ellipses for the Schechter luminosity function parameters α and M* for the best fit to the final set of M81 members, with correction for completeness.
Download figure:
Standard image High-resolution image
Table 6. Faint-end Slope Measurements
| Sample | α ( ) ) |
α ( ) ) |
|---|---|---|
| Previously known |  |
 |
All ( ) ) |
 |
 |
| All (completeness corr.) |  |
 |
Download table as: ASCIITypeset image
Since most of the galaxies we expected to be group members proved to be so, results are not much different from the LF determined previously. The hatched region denotes where incompleteness sets in. Blue triangles represent the original 22 known galaxies. Including the new detections has not greatly changed the LF fit to our 90% completeness limit  . A fit to these counts to the limit
  finds a faint-end slope of
  and
and  for power-law and Schechter function fits, respectively, only −0.03 steeper than found before our survey. We find the same for fits to completeness-corrected counts down to
  with slopes of
  and
and  . Thus, regardless of the numbers of UFDs missed in our survey, to
  , we find a faint-end slope shallower than −1.3. The steepest slope consistent with our data, shown by the 1σ fit (dotted line), is −1.3 whereas Cold Dark Matter theory predicts slopes for the mass function of −1.8 (Trentham & Tully 2002).
Figure 35 displays  versus log Re for the newly confirmed members with late and early types distinguished by color, along with previously known M81 Group members. Also plotted are these quantities for the Local Group (Irwin & Hatzidimitriou 1995; Mateo 1998; McConnachie & Irwin 2006; Simon & Geha 2007; Belokurov et al. 2007; Willman et al. 2005; Walsh et al. 2007; Zucker et al. 2006; Martin et al. 2006; Ibata et al. 2007; Irwin et al. 2008; McConnachie 2012) along with Centaurus and Hydra cluster members (Misgeld & Hilker 2011). To transform V magnitudes to r', we assume r' = V − 0.84(V − R) + 0.13 (Fukugita et al. 1996). Although the M81 Group points lie on top of those from other groups, they clearly fall along the upper envelope of surface brightness for the full range of sizes currently observed for nearby dwarf galaxies. From completeness testing in our original survey, we found that surface brightness affected detection especially at fainter magnitudes. Of note, however, are a dearth of any M81 galaxies in the region between μ = 25–27r' arcsec−2 with
  and log(Re) >2.6, and within a ∼1 mag gap between the majority of previously known objects and newly discovered objects. Detection limits for our original survey are discussed in Paper 1. These were determined by simulating galaxies as concentrations of resolved stars with a wide range of total magnitudes and stellar surface densities. It was determined that we were ∼90% complete to
  for log Re < 3.2, and to −10 for log Re < 2.9. Thus, we do not expect to be missing significant numbers of galaxies in this region. However, given the complete absence of objects detected in a parameter space that one might expect to be populated suggests that some objects may have been missed. Only a few Local Group dwarfs are found in this size–magnitude region so it is conceivable that such galaxies are present in the M81 Group and were missed in our original survey because they lie in regions of higher extinction, reside on the far side of M81 at greater distance, and/or fell directly within the large chip gap regions where effective exposure times were half that of the majority of the survey. At such faint magnitudes, it is also possible that our magnitudes and sizes are underestimated. Indeed, for some of our ACS observed galaxies, including our smallest and faintest object, we do measure larger sizes in the new data. Magnitudes are also expected to be brighter, but, for objects with
  , by not more than several tenths of a magnitude based on the new I-band estimates. Thus, although some of these new detections may shift up and to the right roughly along lines of constant surface brightness, it is unlikely that any of the known faint dwarfs could shift up into this currently empty region of magnitude-size space. If an additional ∼6 objects were included in the LF in the magnitude range
  to −12 with μ = 25–27r' arcsec−2, as one finds for the Local Group galaxies, the resultant LF faint-end slope would increase insignificantly.
In Paper 1, we compared our faint-end slope measurements to that of the CenA group and Andromeda sub-group, finding slopes for these of  and
and  . Since then, another ∼12 dwarfs have been discovered around Andromeda. Of these, only three have magnitudes as bright as MV < −10, while most are in the realm of the UFDs with magnitudes fainter than MV ∼ −8.0. One might expect a number of further discoveries out to greater distances from Andromeda in regions not yet surveyed (McConnachie 2012; Martin et al. 2013), perhaps bringing the LF slope more in line with what we find for the M81 Group, but given the higher completeness fraction at these brighter magnitudes, it is doubtful that the faint-end slope for Andromeda will be revised to much steeper values.
As we found in Paper 1, if the slope were −1.8 as predicted by cosmological structure formation models, between  , we would be missing over 1700 galaxies in our survey area. This is over an order of magnitude greater than we would expect based on our simulations. The agreement in faint-end slope for these nearby groups would therefore suggest that this discrepancy is real, necessitating the use of other explanations to account for the fewer observed dwarf galaxies at these faint magnitudes. Incorporating the effects of feedback and star formation efficiency along with accounting for the suppression of gas infall into the low-mass halos of the forming galaxies by reionization in the early universe may help reconcile theory and observations.
5. SUMMARY AND CONCLUSIONS
From TRGB distance measurements based on two-color imaging with HST/ACS and WFPC2, we have confirmed 14 new members of the M81 Group, out of 22 original candidates, within a 65 deg2 region encompassing the second turnaround radius of the group. Of the 12 candidates originally expected to be group members based on the degree of resolution in CFHT/MegaCam imaging, 11 proved to be so, along with another 3 more uncertain cases. The new members include one tidal dwarf with a young stellar population, three BCDs with ongoing or recent star formation in addition to intermediate and old stellar populations, one dI/dSph transition object with an intermediate-aged population, and nine dSphs with predominantly or pure old stellar populations. The absolute r' magnitudes range from −13.3 to −6.8. Half-light radii range from 370 to 90 pc for galaxies well fit with Sersic profiles. These are typical sizes for faint dwarf galaxies. This brings the total membership of the M81 Group within this region to at least 36 galaxies, including several tidal dwarfs found in the H i streams between the interacting giants M81, M82, and NGC 3077. Additional tidal objects and clumps of star formation have also been identified along the H i streams and within the M81 tidal debris field (Davidge 2008; Mouhcine & Ibata 2010; Karachentsev et al. 2011). Overall, the M81 Group harbors a larger population of late types than the Local Group and appears to be dynamically younger. However, aside from the BCDs and tidal dwarf, the majority of the new detections are found to be dSphs with pure old stellar populations, more in line with the properties of Local Group faint dwarfs.
Using isochrones based on Padova models, we have investigated the stellar populations of each galaxy. The RGB for the dSphs has a broad spread, but this is primarily due to photometric errors at the faint magnitude limits of the observations. The ±1σ allowed metallicity ranges for the RGBs are provided in Table 5, but typically we find Z ∼0.001 for these galaxies. Only a handful of these dSphs host some evidence for younger intermediate-aged populations. The brightest of these, d0944+71 with  , may have experienced a minor episode of star formation as recently as 150 Myr ago, but otherwise exhibits a primarily old stellar population. Interestingly, it lies at a large distance from M81, ∼335 kpc, outside the second turnaround radius for the group, and at a much larger distance than expected based on the morphology–density relation. The faintest dSph with
  displays evidence for a pure old stellar population. This object has properties impinging on the size and brightness range of the UFD galaxies currently being discovered in the Local Group. The new ACS F814W estimates find this object to be slightly brighter and larger than measured previously in MegaCam imaging, with MF814W = −9.1 and size 130 pc, making this more of a borderline case between the ultra-faint and classical dwarfs.
One dI, d0926+70, was identified, although this object may also be considered a transition dwarf. It exhibits only a small amount of recent star formation located near the core of the galaxy. It also appears to have an irregular elongated shape and is located near the periphery of the group. Based on the CMD, there is some evidence for star formation as recently as ∼100 Myr ago along with evidence for an older intermediate-aged population. The metallicity appears to be low for all populations within this galaxy, with no evidence for any significant metal enrichment. Although not detected in this galaxy, H i may simply exist at levels below the detection limit at MH i < 3.1 × 10⁵ M☉. With an effective radius 240 pc and  , this is one of the smallest galaxies with recent star formation known.
The three BCDs are found to have ongoing or very recent star formation. All recent star formation is confined to the galaxy core regions. The BCD with the least recent star formation, d0958+66 with most star formation having occurred over 60 Myr ago, is the closest to the group core. A large fraction of the stellar population in this object appears to have ages within the range 80 Myr–3 Gyr. Perhaps the initial approach and tidal influence exerted by the group potential induced the recent burst of star formation in all three BCDs. Lying outside the second turnaround radius of the group, d1028+70 may have had a period of star formation more recently than 60 Myr. At a distance 0.1 Mpc greater than M81 and with a relative radial velocity of −69 km s−1, this galaxy may be on first approach. We investigate whether the BCDs could fade enough to eventually resemble typical dSphs. For d1012+64 and d0958+66 we find that these galaxies would need to experience ∼2 mag of fading to reach typical surface brightnesses for dSphs of the same size and have metallicities consistent with the metallicity–brightness relation for dSphs.
One tidal dwarf was also identified, confirming a candidate previously detected by Durrell et al. (2004) and adding to several previously known. Mouhcine & Ibata (2010) have since identified another two tidal dwarf candidates. These three additions lie in projection on the M81–NGC 3077 stream and appear to consist entirely of young blue MS and supergiant stars. The RGB visible in the CMD for d0959+68 may actually be due to red giant stars found along the stream, as we see no evidence for a concentration of these at the location of this object in the ACS imaging. Rather, this object appears to have formed all of its stars since around the time of the tidal stream formation. It is not known if there is enough mass for this object to remain bound.
With these new detections, we investigate the faint-end of the galaxy LF of this group, 90% complete down to  . The inclusion of these 14 newly confirmed members increases the faint-end slope only marginally from ∼ − 1.24 to ∼ − 1.27. This analysis applies a correction for incompleteness in our survey down to −7. Although this slope is much shallower than cosmological predictions, it is consistent with what is found in other nearby groups.
We thank the anonymous referee for a thorough reading our manuscript and for providing very helpful suggestions that have improved this paper. Support for Hubble Space Telescope Program numbers 11126 and 11584 were provided by NASA through a grant from the Space Telescope Science Institute, which is operated by the Association of Universities for Research in Astronomy, Incorporated, under NASA contract NAS5-26555. I.D.K. was partially supported by RFBR-DFG grant 12-02-91338. The authors would like to acknowledge Andy Dolphin, Luca Rizzi, and Dmitry Makarov for providing much of the software used for the reduction and analysis of these data.