This is the third post in the large language model latency-throughput benchmarking series, which aims to instruct developers on how to determine the cost of LLM inference by estimating the total cost of ownership (TCO).
See LLM Inference Benchmarking: Fundamental Concepts for background knowledge on common metrics for benchmarking and parameters. See LLM Inference Benchmarking Guide: NVIDIA GenAI-Perf and NIM for tips on using GenAI-Perf and NVIDIA NIM for your applications.
Introduction
Large language models (LLMs) have become an integral and universal part of the modern software industry, functioning akin to an “operating system” base layer upon which many applications are built. These applications include AI assistants, customer support agents, coding co-pilots, and “deep research” assistants.
Recent advances in algorithmic and model efficiency have reduced the cost of training and inference, as demonstrated by the DeepSeek R1 model family. With improved efficiency, LLM applications are expected to be even more affordable and pervasive, consuming more computing resources (aka the Jevons paradox).
Estimating the infrastructure required for these inference applications and the total cost of ownership is a problem that enterprises must face in preparation for deploying generative AI systems and applications at scale. In this post, we’ll address this problem with detailed guidance and step-by-step analysis.
In the rest of this blog post, we lay out steps to follow to:
- Complete performance benchmarking. This generates the data required for infrastructure sizing.
- Analyze benchmark data. Based on performance data on latency and throughput, we can estimate the number of model instances and the number of servers required to serve the anticipated user cohort at an acceptable quality of service level.
- Build a TCO calculator. This enables easier exploration of different deployment scenarios, tradeoffs, and their cost implications.
Performance benchmarking
The prerequisite for sizing and TCO estimation is benchmarking the performance of each deployment unit, e.g., an inference server. The goal of this step is to measure the throughput a system can produce under load, and at what latency. These throughput and latency metrics, together with quality of service requirements (e.g., max latency) and expected peak demand (e.g., max concurrent users or requests per second), will help estimate the required hardware, such as sizing the deployment. In turn, sizing information is a prerequisite for estimating the total cost of ownership (TCO) of the given solution.
NVIDIA GenAI-Perf is a client-side LLM-focused benchmarking tool, providing key metrics such as time to first token (TTFT), intertoken latency (ITL), token per second (TPS), requests per second (RPS), and more. For a foundational explanation of these metrics and how they are measured, see our prior post on LLM performance benchmarking.
For LLMs deployed with NVIDIA NIM microservices, we provide a step-by-step guide to measure the instance’s performance easily. GenAI-perf, however, is a versatile tool that can support any other OpenAI-compatible API, such as vLLM or SGLang. GenAI-perf also supports LLMs deployed with the NVIDIA Dynamo, NVIDIA Triton inference server, and NVIDIA TensorRT-LLM backend.
Analyze benchmark data
Once raw benchmark data are collected, they are analyzed to gain insight into the various performance characteristics of the system. Read our LLM inference benchmarking guide, where we gather NIM performance data with GenAI-perf and use a simple Python script to analyze the data.
For example, performance data provided by GenAI-perf can be used to establish the latency-throughput trade-off curve, shown in Figure 1.

Each dot on this graph corresponds to a “concurrency” level, for example, the number of concurrent requests being put into the system at any given time throughout the benchmark process. The x-axis represents the TTFT latency in milliseconds (ms), while the y-axis represents throughput in requests per second (req/s). Similar plots can be constructed using GenAI-perf data, with latency metrics of TTFT, ITL, or end-to-end request latency, while the throughput metric can be either RPS or tokens per second (TPS).
In most cases, the following tradeoff is shown:
- At low concurrency, the system serves only a small number of concurrent requests. Latency is low, but the throughput is also low (see the left corner of the graph in Figure 2).
- At high concurrency, the system can use the batching effect to serve more requests efficiently, leading to increased throughput. However, this comes at the cost of increased latency (see the upper right of the graph).
When evaluating deployment formats like FP4, FP8, and BF16, the trade-offs between inference speed, memory usage, and accuracy can be visualized on a Pareto front. This curve highlights optimal configurations where no metric can be improved without compromising another, helping developers select the most efficient precision for their workload.
The Pareto front consists of deployment configurations that achieve the highest throughput (e.g., requests per second) for a given latency level (e.g., time to first token). A deployment option is Pareto-optimal if no other option provides a strictly higher throughput at the same or lower latency. Visually, the Pareto front is represented by the set of points closest to the top-left of the chart, where throughput is maximized while keeping latency minimal.

Infrastructure provisioning
To calculate the required infrastructure for a given LLM application, we need to identify the following constraints:
- Latency type and maximum value. This typically depends on the nature of the applications. For example, for chat applications with live interactive responses, keep the average time to first token at or below 250 ms to ensure responsiveness.
- Planned peak requests/s. Account for how many concurrent requests the system is expected to serve. Note that this isn’t the same as the number of concurrent users, because not all will have an active request at once.
Using this information, rule out the unqualified part of the performance chart (in this example, any data point on the right of the 250 ms line). Of the remaining data points that satisfy the latency constraint, we want to select the one with the highest throughput, which will be the most economical option, as shown in Figure 3.

Note: This chart assumes that all the deployment options employ the same number of GPUs. If that is not the case, then the request per second metric should be normalized to request per second per GPU to allow a common ground for comparison.
Read the optimally achievable requests per second figure from the chart. This is the achieved throughput per instance. The number of GPUs used by each instance should also be recorded.
Next, we calculate the required number of model instances as follows:
- Minimum number of model instances: This is calculated as planned peak requests/s divided by optimally achievable requests per second per instance.

Build a TCO calculator
To estimate the amount of hardware and software licenses required and the associated cost, follow these steps and a hypothetical example
First, collect and identify the cost information corresponding to both hardware and software.
| Hardware cost | Example value |
| 1x server cost (initialServerCost) | $320,000 |
| GPUs per server (GPUsPerServer) | 8 |
| Server depreciation period in years (depreciationPeriod) | 4 |
| Hosting cost per server per year (yearlyHostingCost) | $3,000 |
| Software cost | Example value |
| Yearly software licensing cost (yearlySoftwareCost ) | $4,500 |
Next, calculate the total cost following the steps:
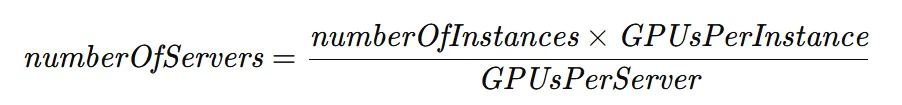
- Number of servers is calculated as the number of instances times the GPUs per instance, divided by the number of GPUs per server.
- Yearly server cost is calculated as the initial server cost divided by the depreciation period (in years), adding the yearly software licensing and hosting costs per server.

- Total cost is calculated as the number of servers required multiplied by the yearly cost per server.

The total cost can be further broken down into cost per volume served, such as cost per 1000 prompts, or cost per million tokens, which are popular cost metrics in the industry.
- Cost per 1000 prompts is calculated as the yearly server cost divided by the total number of requests that a server can serve in a year, assuming 100% uptime. This can be adjusted for the actual uptime fraction.

- Cost per 1 million tokens combines both input and output. We already have the cost per 1,000 prompts (or requests). Note that we also have the use case associated with these prompts, i.e., their input and output sequence length (ISL and OSL). We can therefore calculate the cost per 1M combined tokens as follows:

- Cost per 1M input/output tokens is calculated using the cost ratio between input and output tokens. Since output tokens generally take more time to generate, most commercial LLM-as-a-service providers have separate costs for input and output tokens.
| Token type | Reference cost |
| 1M input tokens (1MinputPrice) | $1 |
| 1M output tokens (1MoutputPrice) | $3 |
Reference cost per 1,000 prompts:

Finally:

Conclusion
In this series of blogs, we’ve walked through the complete process of building a TCO calculator for LLM applications. We’ve covered setting up an inference server, measuring the performance characteristics, estimating the required hardware infrastructure, and then identifying the relevant cost elements to factor into the total cost of ownership equations. This methodological approach will prepare users to build LLM applications and roll them out at scale.
Check out the following resources:
- To learn more about the TCO calculation methodology as well as practice hands-on, you can follow the self-paced “Sizing LLM Inference Systems” online course.
- To learn more about how beyond just FLOPS platform architecture can impact TCO, read the blog post NVIDIA DGX Cloud Introduces Ready-To-Use Templates to Benchmark AI Platform Performance and the collection of ready-to-use templates, performance benchmarking recipes.
- Learn how to lower your cost per token and maximize AI models with The IT Leader’s Guide to AI Inference and Performance.