

Tableau is a data visualization tool that converts raw and complex data into simple, interactive visual insights. It helps users analyze data through charts and dashboards, making interpretation faster and easier for both technical and non-technical users.
- Transforms large datasets into clear visuals to identify trends and patterns easily.
- Enables faster decision-making through interactive and real-time data exploration.
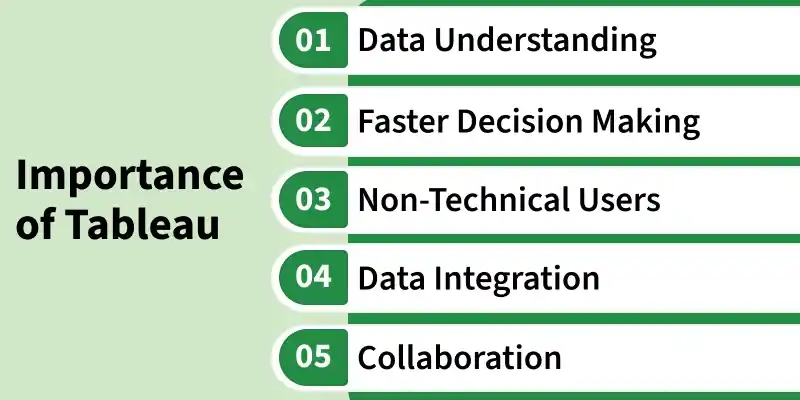
Importance of Tableau
1. Enhances Data Understanding Through Visual Patterns
Tableau helps convert complex datasets into easy-to-understand visual formats, making analysis more intuitive.
- Identifies trends, patterns, and relationships that are difficult to observe in raw data.
- Highlights outliers and anomalies for better data accuracy and insight.
- Simplifies large datasets into visual dashboards for quick interpretation.
Example: A sales team uses Tableau dashboards to quickly spot seasonal sales trends across regions, enabling targeted marketing campaigns.
2. Enables Faster, Data Driven Decision Making
Tableau supports real-time analysis, allowing users to make quicker and more informed decisions.
- Provides interactive dashboards for live data exploration.
- Helps organizations respond quickly to changing conditions.
- Reduces dependency on static reports by enabling dynamic analysis.
Example: Hospital administrators use real-time Tableau dashboards to monitor patient influx and resource availability, optimizing staff allocation in emergencies.
3. Supports Non-Technical Users
Tableau is designed to be user-friendly, allowing users without coding skills to work with data easily.
- Drag-and-drop interface simplifies dashboard creation.
- Enables business users to independently analyze data without technical support.
- Reduces dependency on data engineers for basic reporting tasks.
Example: Marketing professionals create customer engagement reports in Tableau without needing help from data engineers, speeding up campaign analysis.
4. Integrates Multiple Data Sources Seamlessly
Tableau allows users to combine data from different platforms for unified analysis.
- Connects with spreadsheets, databases, and cloud platforms.
- Enables blending of multiple datasets into a single dashboard.
- Supports real-time data integration for updated insights.
Example: A financial analyst combines market, sales, and customer data from different systems into one Tableau dashboard for holistic investment insights.
5. Facilitates Collaborative Data Storytelling
Tableau makes it easier to share insights across teams through interactive dashboards.
- Allows real-time sharing of dashboards with stakeholders.
- Supports collaborative decision-making using shared visual reports.
- Enhances presentation of complex data through clear visual storytelling.
Example: Product development teams use shared dashboards to align on user feedback metrics, enabling cross-functional decisions based on clear data narratives.