Matplotlib is a library in Python and it is numerical - mathematical extension for NumPy library. Pyplot is a state-based interface to a Matplotlib module which provides a MATLAB-like interface. There are various plots which can be used in Pyplot are Line Plot, Contour, Histogram, Scatter, 3D Plot, etc.
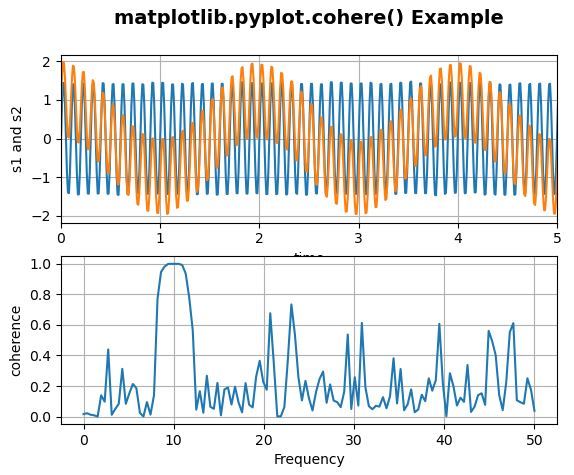
The cohere() function in pyplot module of matplotlib library is used to plot the coherence between x and y. Coherence is the normalized cross spectral density.

Python3 1==
Output:
 Example-2:
Python3 1==
matplotlib.pyplot.cohere() Function:
Syntax: matplotlib.pyplot.cohere(x, y, NFFT=256, Fs=2, Fc=0, detrend=, window=, noverlap=0, pad_to=None, sides='default', scale_by_freq=None, *, data=None, **kwargs) Parameters: This method accept the following parameters that are described below:Below examples illustrate the matplotlib.pyplot.figure() function in matplotlib.axes: Example #1:Returns: This returns the following:
- x, y: These parameter are the sequence of data.
- Fs : This parameter is a scalar. Its default value is 2.
- window: This parameter take a data segment as an argument and return the windowed version of the segment. Its default value is window_hanning()
- sides: This parameter specifies which sides of the spectrum to return. This can have following values : 'default', 'onesided' and 'twosided'.
- pad_to : This parameter contains the integer value to which the data segment is padded.
- Fc: This parameter is also contains the integer value to offsets the x extents of the plot to reflect the frequency range. Its default value is 0
- NFFT : This parameter contains the number of data points used in each block for the FFT.
- detrend : This parameter contains the function applied to each segment before fft-ing, designed to remove the mean or linear trend {'none', 'mean', 'linear'}.
- scale_by_freq : This parameter is allows for integration over the returned frequency values.
- noverlap : This parameter is the number of points of overlap between blocks.
- Fc : This parameter is the center frequency of x.
The resultant is (Cxy, freqs)
- Cxy:This returns the coherence vector..
- freqs :This returns the frequencies for the elements in Cxy.
# Implementation of matplotlib function
import numpy as np
import matplotlib.pyplot as plt

dt = 0.01
t = np.arange(0, 30, dt)
nse1 = np.random.randn(len(t))
nse2 = np.random.randn(len(t))

s1 = 1.5 * np.sin(2 * np.pi * 10 * t) + nse1
s2 = np.cos(np.pi * t) + nse2

plt.cohere(s1, s2**2, 128, 1./dt)
plt.xlabel('time')
plt.ylabel('coherence')
plt.title('matplotlib.pyplot.cohere() Example\n',
               fontsize = 14, fontweight ='bold')
plt.show()
# Implementation of matplotlib function
import numpy as np
import matplotlib.pyplot as plt

dt = 0.01
t = np.arange(0, 30, dt)
nse1 = np.random.randn(len(t))
nse2 = np.random.randn(len(t))
r = np.exp(-t / 0.05)

cnse1 = np.convolve(nse1, r, mode ='same')*dt
cnse2 = np.convolve(nse2, r, mode ='same')*dt

s1 = 1.5 * np.sin(2 * np.pi * 10 * t) + cnse1
s2 = np.cos(np.pi * t) + cnse2 + np.sin(2 * np.pi * 10 * t)

fig, [ax1, ax2] = plt.subplots(2, 1)
ax1.set_title('matplotlib.pyplot.cohere() Example\n',
                    fontsize = 14, fontweight ='bold')

ax1.plot(t, s1, t, s2)
ax1.set_xlim(0, 5)
ax1.set_xlabel('time')
ax1.set_ylabel('s1 and s2')
ax1.grid(True)

ax2.cohere(s1, s2, 256, 1./dt)
ax2.set_ylabel('coherence')
plt.show()
Output: