

A Z-score table helps you find the probability of a value in a standard normal distribution. It shows how much area lies to the left of a particular z-value. The distribution is bell-shaped with a mean 0 and standard deviation 1.
- The rows and columns of the table define the z-score, and the table cells represent the area.
- For example, the z-score 1.50 corresponds to the area 0.9332, which is the probability that a random variable from a standard normal distribution will fall below 1.50.
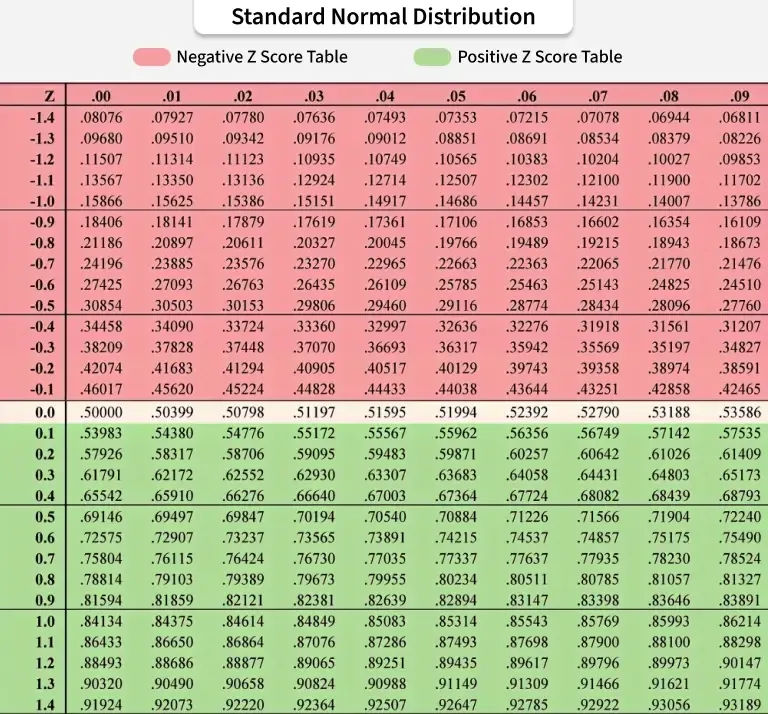
Note: The negative z-scores are below the mean, while the positive z-scores are above the mean.
The z-score table is divided into two sections:
1. Positive Z-Score Table: A data point is above the median if its Z-score is positive (greater than 0), with a higher value denoting a larger divergence from the mean.
2. Negative Z-Score Table: A negative Z-score indicates that the data points are nearer the mean.
How to Use a Z-Score Table
Step 1: Calculate the Z-score: Use the formula to find how many standard deviations X is from the mean.
Step 2: Open the Z-score table: Z-values appear up to two decimals (0.00, 0.01, 0.02, ...).
Step 3: Locate the Z-score: Find the row for the first decimal and the column for the second decimal.
The table value gives P(Z ≤ z).
Example: A school has a normally distributed test score with a mean (μ) of 75 and a standard deviation (σ) of 10. A student wants to know the probability of scoring less than 80 on a test.
Solution:
Calculate the Z-score:
Z = 80 −75/10
⇒ Z = 0.5Look at the Z-scores in the Z-score table to find the corresponding cumulative probability. Let’s say 0.6915.
Thus, the probability of a student scoring less than 80 would be 0.6915 or 69.15%.
How to Interpret Z-Score
- Positive z-score -> value is above the mean. Example: Z = 2 -> 2 standard deviations above the mean.
- Negative z-score -> value is below the mean. Example: Z = −1.5 -> 1.5 standard deviations below the mean.
Applications of Z Score
Z-scores are widely used in many areas, such as:
- Comparing data in statistics and detecting outliers
- Financial analysis (e.g., Altman Z-score for bankruptcy prediction)
- Medical and growth assessments using reference charts
- Performance comparison in sports and academics
- Hypothesis testing, confidence intervals and general data analysis
➣Practice: Solved Examples