

The Least Squares Method is used to find the best-fitting line or curve for a set of data points.
- It is widely used in statistics, regression analysis, data fitting and predictive modeling.
- Minimizes the sum of squared differences between the observed data points and the predicted values.
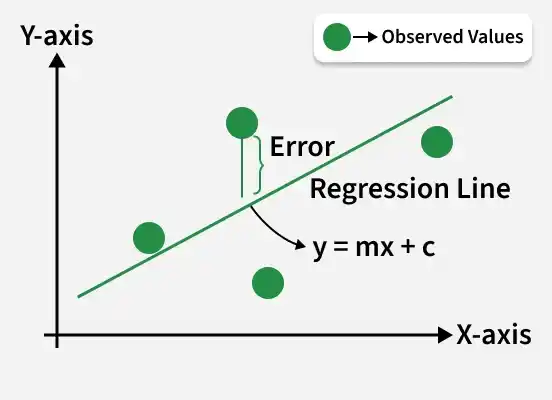
Why use the least squares method?
When you have data points that don't perfectly align on a single line or curve, you want to find the line/curve that comes "closest" to all the points overall. Least squares does this by minimizing the total squared error.
Formula
The least squares method formula finds the best-fitting line through a set of data points. For a simple linear regression, which is a line of the form
y = mx+c,
- m is the slope of the line,
- c is the y-intercept,
The formulas to calculate the slope (m) and intercept (c) of the line are derived from the following equations:
- Slope (m) Formula:
m = \frac{n\sum xy - (\sum x)(\sum y)}{n\sum x^2 - (\sum x)^2} - Intercept (c) Formula:
c = \frac{\sum y - m\sum x}{n}
Where:
- n is the number of data points,
- ∑xy is the sum of the product of each pair of x and y values,
- ∑x is the sum of all x values,
- ∑y is the sum of all y values,
- ∑x2 is the sum of the squares of the x values.
Steps to find the line of Best Fit
- Step 1: Denote the independent variable values as xi and the dependent ones as yi.
- Step 2: Calculate the average values of xi and yi as X and Y.
- Step 3: Presume the equation of the line of best fit as y = mx + c, where m is the slope of the line and c represents the intercept of the line on the Y-axis.
- Step 4: The slope m can be calculated from the following formula:
m = [Σ (X - xi)×(Y - yi)] / Σ(X - xi)2
- Step 5: The intercept c is calculated from the following formula:
c = Y - mX
Thus, we obtain the line of best fit as y = mx + c, where values of m and c can be calculated from the formulae defined above.
These formulas are used to calculate the parameters of the line that best fits the data according to the criterion of the least squares, minimizing the sum of the squared differences between the observed values and the values predicted by the linear model.
How Do You Calculate Least Square?
To calculate the least squares solution, you typically need to:
- Choose the model form: Decide on the type of equation you believe best fits the data (e.g., a straight line, y = mx + c).
- Calculate the residuals: Find the differences between the observed values and the values predicted by your model:
\text{residual} = y_{\text{actual}} - y_{\text{predicted}} - Square each residual and sum them up: This gives the total error:
S = \sum_{i=1}^{n} (y_i - \hat{y}_i)^2 - Minimize the sum using calculus: Take the partial derivative of S with respect to each unknown parameter (like m and c), set them equal to zero, and solve the resulting equations.
Limitations
- The Least Squares Method is sensitive to outliers because squaring the residuals gives greater weight to large errors.
- It also assumes that the chosen model appropriately represents the relationship between the variables.
- If the data contains significant outliers or follows a non-linear pattern, the fitted line may not accurately represent the data.
Real-Life Applications
- Predicting housing prices using linear regression.
- Estimating trends in the financial market.
- Fitting Curves to experimental data in physics and chemistry.
- Calibrating sensors in engineering.
➢Practice: Solved Examples