

Correlation and Regression are statistical methods used to examine relationships between variables. Correlation measures the strength and direction of a relationship, while regression helps predict one variable based on another.

Correlation
Correlation is a statistical measure that describes the strength and direction of the relationship between two variables. It is represented by the correlation coefficient (r), which ranges from −1 to +1.
Types of Correlation
Correlation can be classified into different types based on the direction of the relationship between variables.
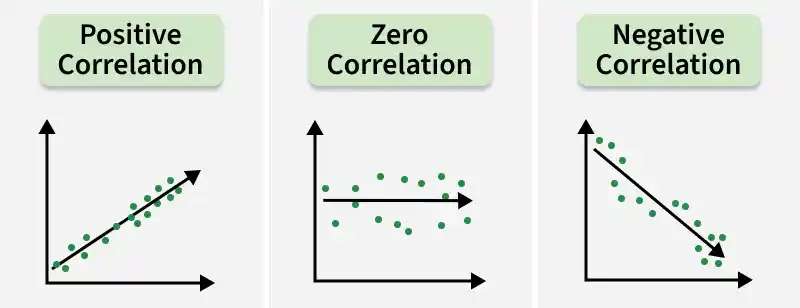
Positive Correlation: A positive correlation occurs when both variables move in the same direction. As one variable increases, the other also increases, and vice versa.
Zero or No Correlation: There is no significant relationship between the variables. A change in one variable does not affect the other. The correlation coefficient is r = 0.
Negative Correlation: A negative correlation occurs when the variables move in opposite directions. As one variable increases, the other decreases.
Types of Correlation Coefficients
Some of the common correlation coefficients are:
- Pearson Correlation Coefficient (r): Measures the linear relationship between two continuous variables.
- Spearman's Rank Correlation (ρ): Measures the relationship between ranked variables.
- Kendall's Tau (τ): Measures the strength of association between ranked variables.
Regression
Regression is a statistical technique used to examine the relationship between a dependent variable and one or more independent variables. It helps predict the value of the dependent variable based on the values of the independent variables.
Types of Regression
Regression can be classified into different types based on the nature of the relationship between variables.
Simple Linear Regression: Simple linear regression examines the relationship between one independent variable and one dependent variable using a straight-line equation.
Multiple Linear Regression: Multiple linear regression analyzes the effect of two or more independent variables on a single dependent variable.
Polynomial Regression: Polynomial regression models a nonlinear relationship between variables using a polynomial equation.
Logistic Regression: Logistic regression is used when the dependent variable is categorical, such as yes/no or pass/fail outcomes.
Formulas
Formulas related to Correlation and Regression are:
Correlation Formula: The Pearson correlation coefficient (r) is calculated using the formula:
r = \frac{\sum (X - \bar{X})(Y - \bar{Y})}{\sqrt{\sum (X - \bar{X})^2 \sum (Y - \bar{Y})^2}}
Simple Linear Regression Formula: The regression line is represented as:
Y = a + bX
- Y is the dependent variable,
- X is the independent variable,
- a is the intercept,
- b is the slope.
➢Practice: Solved Examples