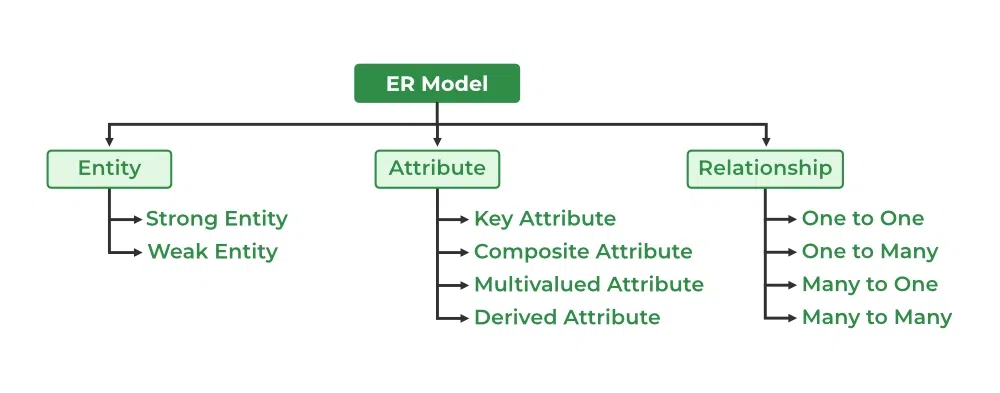
The Entity-Relationship Model (ER Model) is a conceptual model for designing a database. This model represents the logical structure of a database, including entities, their attributes, and relationships between them.
- Entity: An object that is stored as data. E.g: Student, Course, or Company.
- Attribute: Properties that describe an entity. E.g: StudentID, CourseName, or EmployeeEmail.
- Relationship: A connection between entities. E.g: Student enrolls in a Course.
The graphical representation of this model is called an Entity-Relation Diagram (ERD).
ER Model in Database Design Process
We typically follow the below steps for designing a database for an application.
- Gather the requirements (functional and data) by asking questions to the database users.
- Create a logical or conceptual design of the database. This is where ER model platheys a role. It is the most used graphical representation of the conceptual design of a database.
- After this, focus on physical database design (like indexing) and external design (like views).
Uses of ER Diagrams in DBMS
- ER diagrams represent the E-R model in a database, making them easy to convert into relations (tables).
- These diagrams serve the purpose of real-world modeling of objects which makes them intently useful.
- Unlike technical schemas, ER diagrams require no technical knowledge of the underlying DBMS used.
- They visually model data and its relationships, making complex systems easier to understand.
Symbols Used in ER Model
ER Model is used to model the logical view of the system from a data perspective which consists of these symbols:

Entity
It represents a real-world object, concept or thing about which data is stored in a database. It act as a building block of a database. Tables in relational database represent these entities.
Example of entities:
- Real-World Objects: Person, Car, Employee etc.
- Concepts: Course, Event, Reservation etc.
- Things: Product, Document, Device etc.
The entity type defines the structure of an entity, while individual instances of that type represent specific entities.
Entity Set
Refers to an individual object of an entity type, and the collection of all entities of a particular type is called an entity set. For example, E1 is an entity that belongs to the entity type "Student," and the group of all students forms the entity set.

We can represent the entity sets in an ER Diagram but we can't represent individual entities because an entity is like a row in a table, and an ER diagram shows the structure and relationships of data, not specific data entries (like rows and columns). An ER diagram is a visual representation of the data model, not the actual data itself.
Types of Entity
There are two main types of entities:
1. Strong Entity
A type of entity that has a key Attribute that can uniquely identify each instance of the entity. A Strong Entity does not depend on any other Entity in the Schema for its identification. It has a primary key that ensures its uniqueness and is represented by a rectangle in an ER diagram.
2. Weak Entity
It cannot be uniquely identified by its own attributes alone. It depends on a strong entity to be identified. A weak entity is associated with an identifying entity (strong entity), which helps in its identification. A weak entity are represented by a double rectangle. The participation of weak entity types is always total. The relationship between the weak entity type and its identifying strong entity type is called identifying relationship and it is represented by a double diamond.
Example:
A company may store the information of dependents (Parents, Children, Spouse) of an Employee. But the dependents can't exist without the employee. So dependent will be a Weak Entity Type and Employee will be identifying entity type for dependent, which means it is Strong Entity Type.

Attributes in ER Model
Attributes are the properties that define the entity type. For example, for a Student entity Roll_No, Name, DOB, Age, Address, and Mobile_No are the attributes that define entity type Student. In ER diagram, the attribute is represented by an oval.

Types of Attributes
1. Key Attribute
The attribute which uniquely identifies each entity in the entity set is called the key attribute. For example, Roll_No will be unique for each student. In ER diagram, the key attribute is represented by an oval with an underline.

2. Composite Attribute
An attribute composed of many other attributes is called a composite attribute. For example, the Address attribute of the student Entity type consists of Street, City, State, and Country. In ER diagram, the composite attribute is represented by an oval comprising of ovals.

3. Multivalued Attribute
An attribute consisting of more than one value for a given entity. For example, Phone_No (can be more than one for a given student). In ER diagram, a multivalued attribute is represented by a double oval.

4. Derived Attribute
An attribute that can be derived from other attributes of the entity type is known as a derived attribute. e.g.; Age (can be derived from DOB). In ER diagram, the derived attribute is represented by a dashed oval.

The Complete Entity Type Student with its Attributes can be represented as:

Relationship Type and Relationship Set
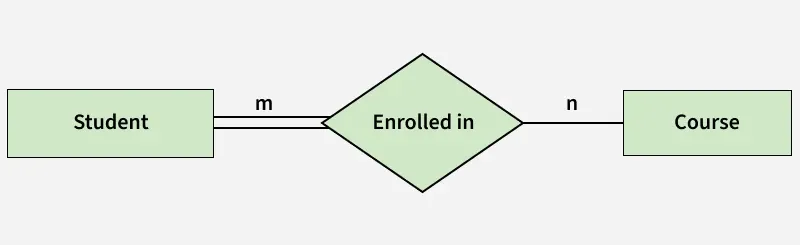
A Relationship Type represents the association between entity types. For example, ‘Enrolled in’ is a relationship type that exists between entity type Student and Course. In ER diagram, the relationship type is represented by a diamond and connecting the entities with lines.

A set of relationships of the same type is known as a relationship set. The following relationship set depicts S1 as enrolled in C2, S2 as enrolled in C1, and S3 as registered in C3.

Degree of a Relationship Set
The number of different entity sets participating in a relationship set is called the degree of a relationship set.
1. Unary/Recursive Relationship: When there is only ONE entity set participating in a relation. For example, one person is married to only one person.

Read more about - Recursive Relationship
2. Binary Relationship: When there are TWO entities set participating in a relationship. For example, a Student is enrolled in a Course.
3. Ternary Relationship: When there are three entity sets participating in a relationship.

4. N-ary Relationship: When there are n entities set participating in a relationship, the relationship is called an n-ary relationship.

Cardinality in ER Model
The maximum number of times an entity of an entity set participates in a relationship set is known as cardinality.
Cardinality can be of different types:
1. One-to-One
When each entity in each entity set can take part only once in the relationship, the cardinality is one-to-one. Let us assume that one person can be issued only one passport, and one passport is issued to only one person. So, the relationship will be One-to-One (1 : 1), meaning that each person has a single passport, and each passport belongs to a single person.

Using Sets, it can be represented as:

2. One-to-Many
In a one-to-many relationship, one entity can be associated with multiple entities. For example, a single Surgeon Department can have many Doctors. Therefore, the cardinality of this relationship is 1 to M, meaning one department can have many doctors.

Using sets, one-to-many cardinality can be represented as:

3. Many-to-One
When entities in one entity set can take part only once in the relationship set and entities in other entity sets can take part more than once in the relationship set, cardinality is many to one.
Let us assume that multiple surgeries can be performed by one surgeon, but one surgery is performed by only one surgeon. So, the cardinality will be M to 1, meaning that many surgeries can be done by a single surgeon, but each surgery is done by only one surgeon.

Using Sets, it can be represented as:

In this case, each student is taking only 1 course but 1 course has been taken by many students.
4. Many-to-Many
When entities in all entity sets can take part more than once in the relationship cardinality is many to many. Let us assume that an employee can work on multiple projects and each project can have multiple employees working on it. So, the relationship will be many-to-many (M:N), meaning that one employee may be associated with several projects, and one project may involve several employees.

Using Sets, it can be represented as:

In this example, student A1 is enrolled in B1,B2 and B3, and course B3 is taken by A1, A2, and A3. Therefore, this represents a many-to-many relationship.
Participation Constraint
Participation Constraint is applied to the entity participating in the relationship set.
- Total Participation: Each entity in the entity set must participate in the relationship. If each student must enroll in a course, the participation of students will be total. Total participation is shown by a double line in the ER diagram.
- Partial Participation: The entity in the entity set may or may NOT participate in the relationship. If some courses are not enrolled by any of the students, the participation in the course will be partial.
The diagram depicts the 'Enrolled in' relationship set with Student Entity set having total participation and Course Entity set having partial participation.
Using Set, it can be represented as,

Every student in the Student Entity set participates in a relationship but there exists a course C4 that is not taking part in the relationship.
How to Draw an ER Diagram
- Identify Entities: The very first step is to identify all the Entities. Represent these entities in a Rectangle and label them accordingly.
- Identify Relationships: The next step is to identify the relationship between them and represent them accordingly using the Diamond shape. Ensure that relationships are not directly connected to each other.
- Add Attributes: Attach attributes to the entities by using ovals. Each entity can have multiple attributes (such as name, age, etc.), which are connected to the respective entity.
- Define Primary Keys: Assign primary keys to each entity. These are unique identifiers that help distinguish each instance of the entity. Represent them with underlined attributes.
- Remove Redundancies: Review the diagram and eliminate unnecessary or repetitive entities and relationships.
- Review for Clarity: Review the diagram make sure it is clear and effectively conveys the relationships between the entities.