

Seaborn is a powerful Python visualization library built on top of Matplotlib, providing a high-level interface for drawing attractive and informative statistical graphics. One common task when creating visualizations is adding titles to plots to make them more informative and easier to understand. This article will guide you through the process of adding titles to Seaborn boxplots, covering various methods and providing detailed examples.
Table of Content
Adding Titles to Seaborn Boxplots
There are several methods to add titles to Seaborn boxplots. We will explore the most common ones: using the set() method, the set_title() method, and the suptitle() method.
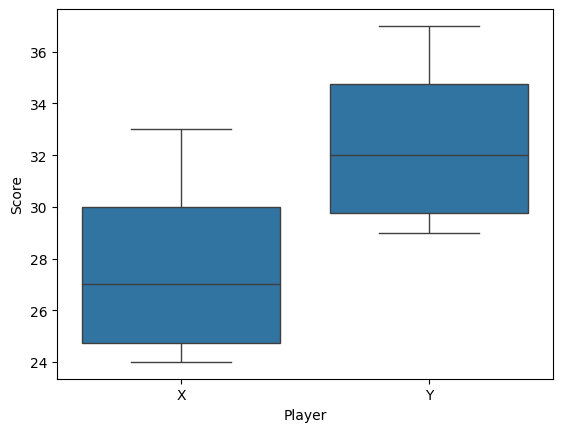
For implementation, we will use below dataframe:
import pandas as pd
import seaborn as sns
import matplotlib.pyplot as plt

# Sample data
data = pd.DataFrame({
    'Score': [33, 24, 29, 25, 30, 29, 34, 37],
    'Player': ['X', 'X', 'X', 'X', 'Y', 'Y', 'Y', 'Y']
})

# Create a boxplot
sns.boxplot(data=data, x='Player', y='Score')
plt.show()
Output:
Method 1: Using the set() Method
The set() method is a versatile way to set various properties of the plot, including the title.
# Create a boxplot and set the title using the set() method
sns.boxplot(data=data, x='Player', y='Score').set(title='Scores by Player')
plt.show()
Output:
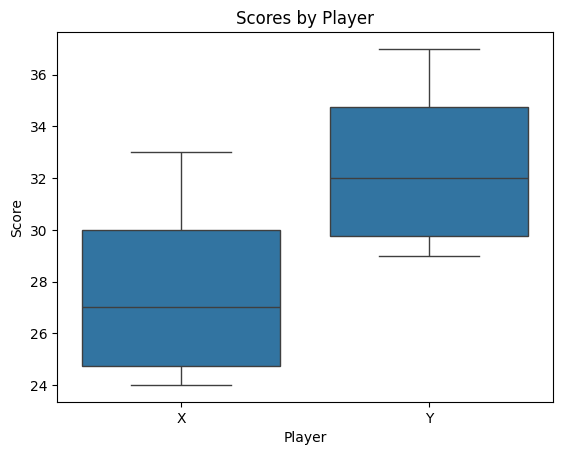
In this example, the set() method is used to add the title "Scores by Player" to the boxplot.
Method 2: Using the set_title() Method
The set_title() method is another way to add a title to a Seaborn plot. This method is called on the Axes object returned by the sns.boxplot() function.
# Create a boxplot and set the title using the set_title() method
ax = sns.boxplot(data=data, x='Player', y='Score')
ax.set_title('Scores by Player')
plt.show()
Output:
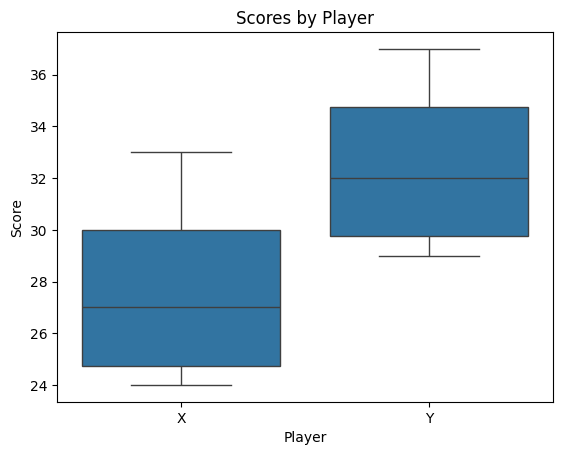
Here, the set_title() method is used to set the title of the plot. This method provides more flexibility for further customization of the Axes object.
Method 3: Using the suptitle() Method
The suptitle() method is used to add a title to the entire figure, which is useful when you have multiple subplots.
# Create a boxplot and set the title using the suptitle() method
fig, ax = plt.subplots()
sns.boxplot(data=data, x='Player', y='Score', ax=ax)
fig.suptitle('Scores by Player')
plt.show()
Output:
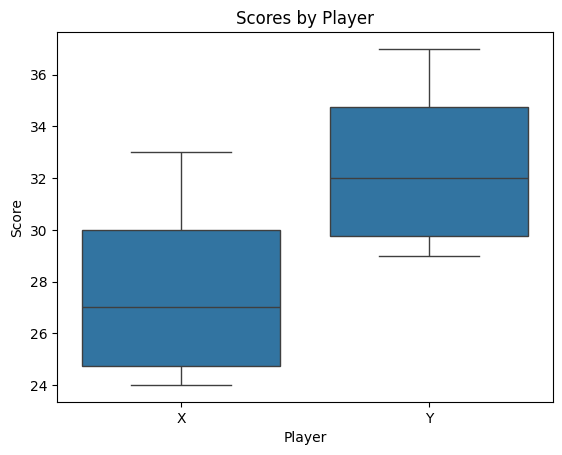
In this example, the suptitle() method is used to add a title to the entire figure, which contains the boxplot.
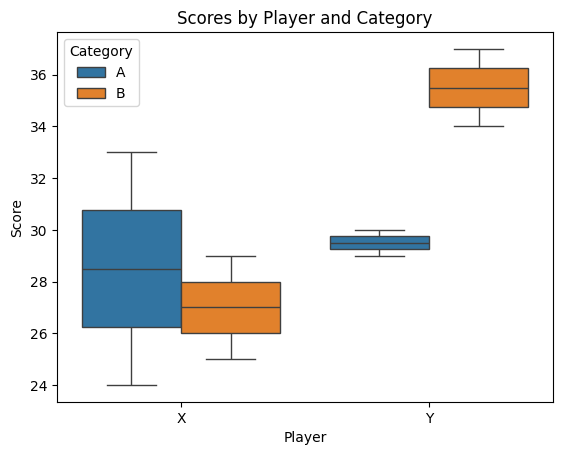
Advanced Customizations for Adding Title
In addition to adding titles, you can customize other aspects of the plot, such as axis labels, legend, and more.
# Sample data with an additional category
data = pd.DataFrame({
    'Score': [33, 24, 29, 25, 30, 29, 34, 37],
    'Player': ['X', 'X', 'X', 'X', 'Y', 'Y', 'Y', 'Y'],
    'Category': ['A', 'A', 'B', 'B', 'A', 'A', 'B', 'B']
})

# Create a boxplot with a legend
ax = sns.boxplot(data=data, x='Player', y='Score', hue='Category')
ax.set_title('Scores by Player and Category')
plt.legend(title='Category')
plt.show()
Output:
Practical Example : Adding the title to a Seaborn boxplot
Here’s a working example using the "tips" dataset, which contains information about restaurant tips, including the total bill, tip amount, and other factors.
Let's create a boxplot with a title:
import seaborn as sns
import matplotlib.pyplot as plt

# Load the "tips" dataset
tips = sns.load_dataset("tips")

# Create the boxplot
sns.boxplot(x="day", y="total_bill", data=tips)

# Add title to the boxplot
plt.title("Total Bill Distribution by Day")

# Add labels
plt.xlabel("Day of the Week")
plt.ylabel("Total Bill")

# Display the boxplot
plt.show()
Output:
.png)
Conclusion
Adding titles to Seaborn boxplots is a straightforward process that can significantly enhance the readability and informativeness of your visualizations. Whether you use the set(), set_title(), or suptitle() method, each approach offers flexibility and ease of use. By mastering these techniques, you can create more effective and professional-looking plots.