Logging
By default, SelectZero logs application events on a file level with log rotation. Log rotation keeps logs for maximum of 10 days or 100MB log file size.
Rotated logs are moved to /logs/archived
Log types:
General logs - Application's user and system actions
SQL logs - All executed SQL queries
Security logs - Application's request logs
Import/Export logs - Logs about imported and exported entities
AI assistant - Logs about calls to the AI assistant API
System - Logs about internal system actions and errors (including stacktrace)
In-app log viewer
Logs can be viewed directly inside the application from the logs modal, accessible from the top navigation bar.
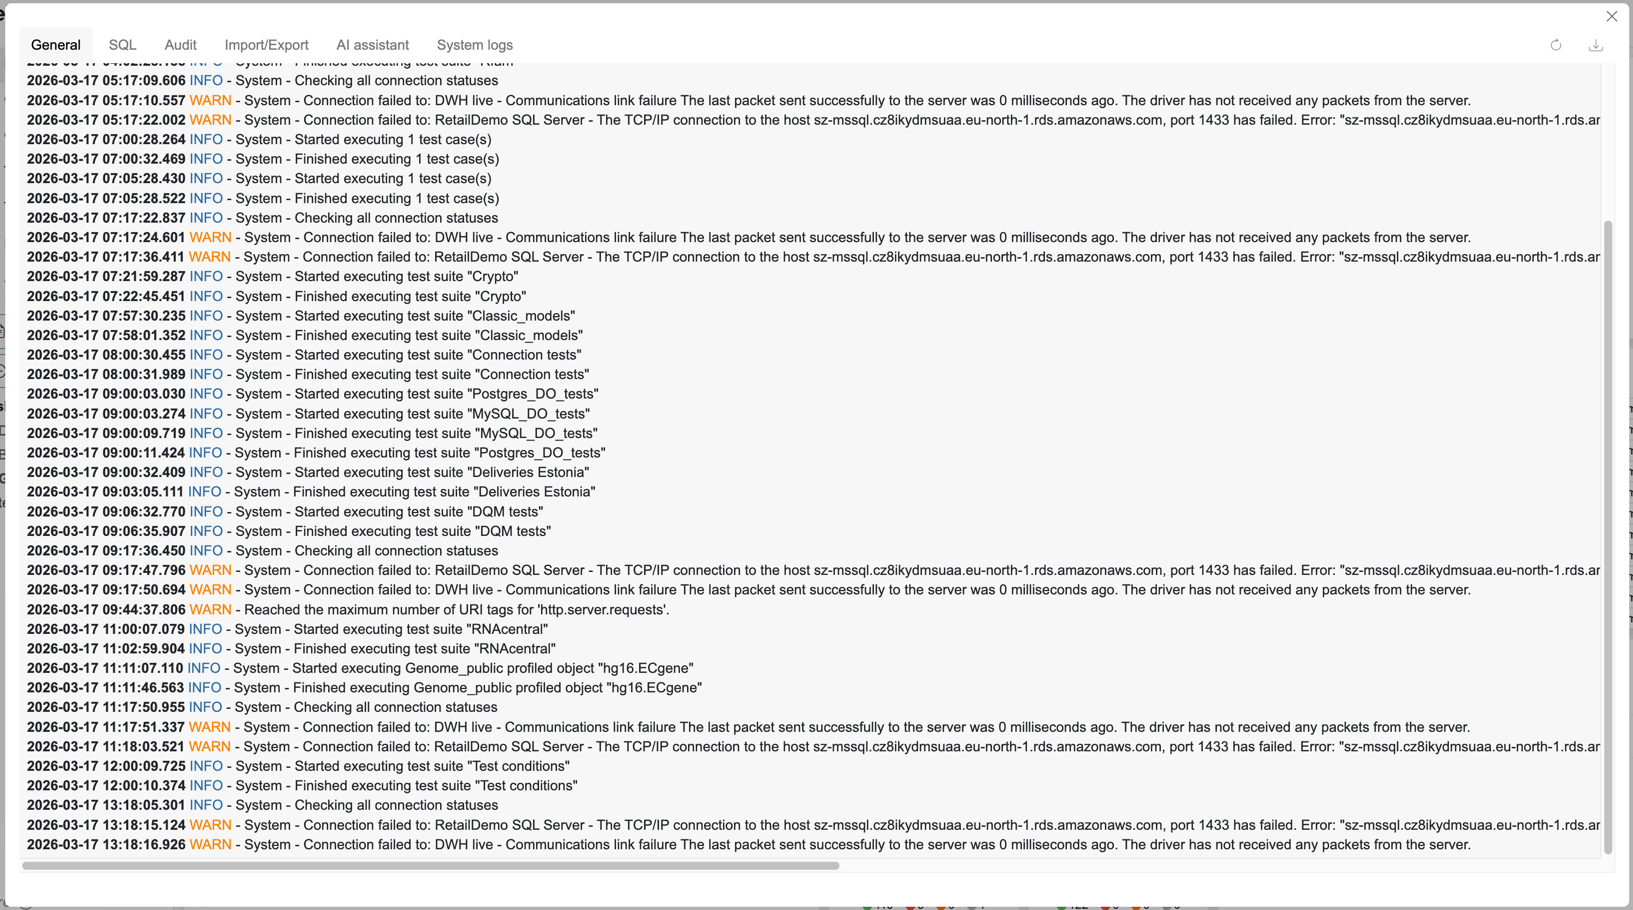
Access and permissions
Users with the View dashboard privilege — can view the General log. With
SZ_LOG_PSEUDONYMIZEon, they see a hashed id in place of each login nameAdmins — can view all log types via tabs and download archived log files
Viewing logs
Admins can switch between log types using the tab bar at the top of the modal:
General — application user and system actions
SQL — all executed SQL queries
Security — application request logs
Import/Export — logs about imported and exported entities
AI assistant — logs about calls to the AI assistant API
System — internal system actions and errors, including stack traces
Downloading archived logs
Admins can open the Download modal to access archived log files. Files are grouped by log type. Hover over a file to reveal the download button.
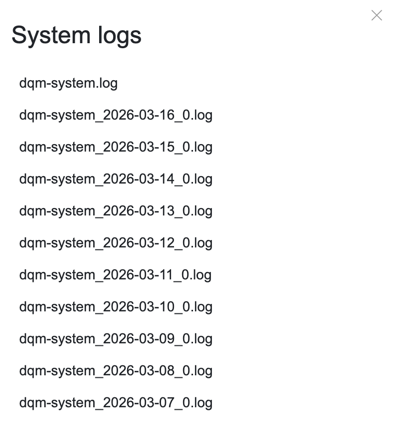
Default format
Platform logs follow pattern
Timestamp - ISO 8601 formatted timestamp
Log level - INFO, WARN, ERROR levels
IP / Session ID - Request origin IP and user hashed session ID
User - Application user
Message - Log message
Hiding user identity on standard output
Standard output is what container platforms and central log collectors pick up. Set the environment variable SZ_LOG_PSEUDONYMIZE=true to keep login names and client IP addresses out of it:
User - replaced by
u-and the first 12 characters of the SHA-256 hash of the login name. The same user always gets the same id, across restarts and pods, so you can still follow one user's actions.IP - the last part is masked:
10.1.2.xfor IPv4, the first three groups for IPv6.
The JSON log file, which is meant for collectors too, gets the same treatment: user.name holds the u- id and client.address the masked IP. The message text is not changed: the JSON file carries every stream in full, so check what ends up in your SIEM before you forward it.
The text log files are not changed: logs/dqm.log and the other log files keep the plain login name and IP. In the in-app log viewer, users who are not admins see the u- id instead of the login name in the General log; admins still see the name, so an admin who needs to know who a u- id is can find the same line there or in logs/dqm.log.
The id is a plain hash, not an encryption: anyone who already knows a login name can compute its id. It keeps names and email addresses out of shipped logs and PII scanners; it is not meant to make a known user untraceable.
Default false: the format above stays exactly as it was.
JSON log file for external collectors
Set the environment variable SZ_LOG_JSON=true and SelectZero additionally writes every log stream into one file, logs/dqm.json, one JSON object per line. The six text files above keep working exactly as before; the JSON file is a copy meant for a log collector such as Filebeat, rsyslog or Elastic Agent to tail. Nothing is sent over the network by the application itself. The file rotates like the text files (10 MB per file, 10 days, 100 MB in total, archives in logs/archived/), and it is not shown in the in-app log viewer or the archive download.
Field names follow the Elastic Common Schema (ECS) where a field exists there; the SelectZero-specific ones live under dqm..
Field | Content |
|---|---|
| Event time, ISO 8601 in UTC |
|
|
| Logger name |
| Log message. Line breaks inside it are escaped, so the line stays one line |
| Which log the event belongs to: |
| Thread that logged the event |
| Application user, request origin address and hashed session ID. Present when the event was logged inside a user request. With |
| Database user that ran the query. Present on SQL log lines from profiling |
| Present when an exception was logged. The full stack trace, including causes, is one string field |
| Constant |
Filebeat
A filestream input with the ndjson parser reads the file and turns each line into one event with the fields above. expand_keys turns the dotted names into nested objects, which is what Elasticsearch and Logstash expect. The commented processor shows how to keep query text out of the SIEM.
With Docker Compose this is the filebeat service from the sidecar example below, with the environment of the dqm service extended by SZ_LOG_JSON: "true" and this filebeat.yml mounted in place of the one shown there. On Windows, run Filebeat as a service with the same input pointed at logs\dqm.json in the SelectZero directory. SelectZero does not write to the Windows Event Log.
rsyslog (Linux syslog route)
The imfile module tails the file and forwards each line as the message part of a syslog record, so the central syslog server receives the JSON intact. Two things matter: raise maxMessageSize on both the sending and the receiving rsyslog, because a line with a stack trace exceeds the 8 KB default and would otherwise arrive truncated and no longer be valid JSON, and give the input its own ruleset so SelectZero lines are not mixed into the local system log.
Put it in /etc/rsyslog.d/selectzero.conf and restart rsyslog. rsyslog applies maxMessageSize only to modules loaded after it, so on a stock installation move that line to the top of /etc/rsyslog.conf, ahead of the distribution's own module(load=...) lines. Adjust the File path to where the SelectZero JAR or the mounted logs volume lives; imfile follows the rotation done by the application.
Elastic Agent
With Fleet, add the Custom Logs (Filestream) integration to the agent policy, set the log file path to the mounted logs/dqm.json, and paste the parser below into Custom configurations. For a standalone agent the same settings go into the input in elastic-agent.yml:
The Filebeat and rsyslog configurations on this page were run against the file SelectZero writes. The Elastic Agent input is the same Filestream input as Filebeat's and is taken from Elastic's documentation; it was not run against a Fleet server.
Using Filebeat as Sidecar for log forwarding
As the SelectZero platform is a simple containerized platform, log aggregation and security monitoring can be configured on deployment side. You can use Filebeat to forward logs to a central service such as Logstash or Graylog.
Example docker-compose.yml:
Example of filebeat.yml:
Logging on Kubernetes
Two things change when SelectZero runs in a pod.
Only the general log reaches standard output. The root logger writes to both standard output and logs/dqm.log, so kubectl logs and any cluster log collector receive the general log with no extra configuration. The SQL, Security, Import/Export, AI assistant and System logs are routed to their files only. They never appear on standard output. Set SZ_LOG_PSEUDONYMIZE: "true" in the container's env to hide login names and IP addresses on standard output.
Log files live and die with the pod. In a stateless deployment logs/ is an emptyDir, so the in-application log viewer and the archived log download show only what the current pod has written. After a restart they start empty. Log files are not stored in the S3 bucket.
Together that means: collect standard output and you have the general log kept for as long as your cluster keeps it. If you also need the SQL or Security logs retained beyond a pod's lifetime, run a log shipper as a sidecar sharing the logs volume. The filebeat.yml from the sidecar example works unchanged; or set SZ_LOG_JSON: "true" in the selectzero container's env and point the sidecar at /logs/dqm.json with the JSON input, which gives every stream as structured events from one file. Either way, mount the same volume into both containers:
With the Helm chart, create the ConfigMap from the filebeat.yml of the sidecar example and add the sidecar through your values file. The log volume is named logs in S3 storage mode; in the persistent volume mode it is the storage volume with subPath: logs.
See Kubernetes deployment for the chart and the full deployment manifests.