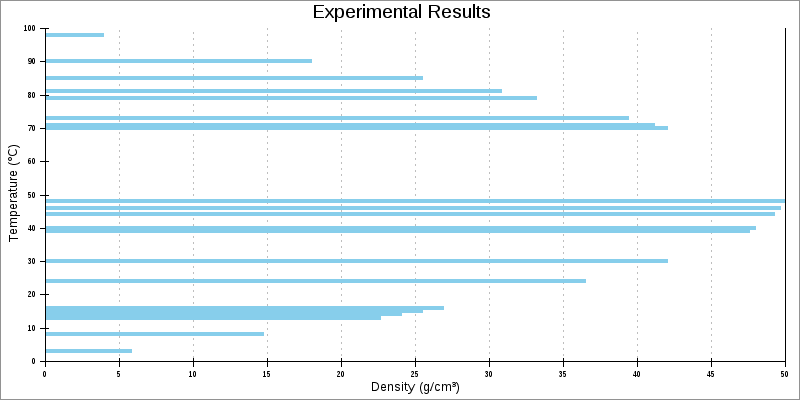
This example shows a horizontal thin bar line (thinbarline) plot. As always, the X axis is horizontal, and the Y axis is vertical. The data type 'data-data-yx' indicates this is a horizontal plot, with explicit independent (Y) variables. There is one X for each Y. With this data type, the independent variable values need not be in order or sequential in the data array.
Example�5.29.�Horizontal Thin Bar Line Plot
<?php
# PHPlot example - horizontal thinbarline plot (impulse plot)
require_once 'phplot.php';
$data = array(
array('', 79, 33.18), array('', 13, 22.62), array('', 71, 41.18),
array('', 8, 14.72), array('', 48, 49.92), array('', 46, 49.68),
array('', 90, 18.00), array('', 15, 25.50), array('', 73, 39.42),
array('', 30, 42.00), array('', 24, 36.48), array('', 85, 25.50),
array('', 14, 24.08), array('', 3, 5.82), array('', 98, 3.92),
array('', 39, 47.58), array('', 70, 42.00), array('', 16, 26.88),
array('', 81, 30.78), array('', 40, 48.00), array('', 44, 49.28),
);
$plot = new PHPlot(800, 400);
$plot->SetImageBorderType('plain'); // Improves presentation in the manual
$plot->SetUseTTF(True);
$plot->SetTitle('Experimental Results');
$plot->SetXTitle('Density (g/cm³)'); // 179=superscript 3
$plot->SetYTitle('Temperature (°C)'); // 176=degrees
$plot->SetPlotType('thinbarline');
$plot->SetDataType('data-data-yx');
$plot->SetDataValues($data);
$plot->SetPlotAreaWorld(0, 0, 50, 100);
$plot->SetLineWidths(4);
$plot->DrawGraph();