Spot gold prices slip by 1% as inflation fears resurface after new U.S. strikes

WTI front-month crude fell 5.2% to $91.55 on Tuesday after U.S. naval forces sank two Islamic Revolutionary Guard Corps vessels that were attempting to lay mines in the Strait of Hormuz. The strike did not end the ceasefire — but it confirmed that the physical chokepoint remains contested, and that every diplomatic headline now carries asymmetric price risk.

I. A Ceasefire That Has Not Stopped the Shooting
The incident on Monday, May 25 occupies an unusual position in the 2026 Hormuz crisis: it was simultaneously a military action and a diplomatic signal. U.S. Central Command stated it targeted two IRGC vessels that were laying sea mines, and subsequent surface-to-air missile fire from Iranian positions near Bandar Abbas drew additional American airstrikes against those launch sites. CENTCOM described both actions as defensive, and the White House has not characterized the exchanges as a ceasefire breach.
President Trump told reporters that talks toward a more durable cessation of hostilities had been "productive," while Secretary of State Marco Rubio, speaking in India, stated that the strait "will be open one way or another." Negotiations continue in Qatar over the framework language of a deal that would formally reopen the waterway and end the broader conflict that began February 28, 2026, when the U.S. and Israel launched coordinated strikes on Iranian military infrastructure, including the killing of Supreme Leader Ali Khamenei.
The initial ceasefire took effect on April 8. Since then, the U.S. has maintained a naval blockade on Iranian ports initiated on April 13, creating what analysts have described as a dual-blockade arrangement: Iran continues to restrict commercial transit through the strait while the U.S. denies export revenue to Iran via port interdiction. The framework under discussion would see the U.S. lift the blockade in exchange for Iran formally reopening the strait over a two-month transition period.
Asian equity markets reflected the ambiguity on Tuesday. Japan’s Nikkei fell 0.3% and Australia’s S&P/ASX 200 declined 0.7%, while South Korea’s Kospii rose 3.3%. The divergence reflects an underlying tension between escalation risk and residual optimism that a deal remains on the near-term horizon.
II. Technical Snapshot: WTI Crude Oil (CLN26 — Jul ’26)
The table below summarizes the key price structure and momentum indicators for the July WTI contract as of May 26, 2026.
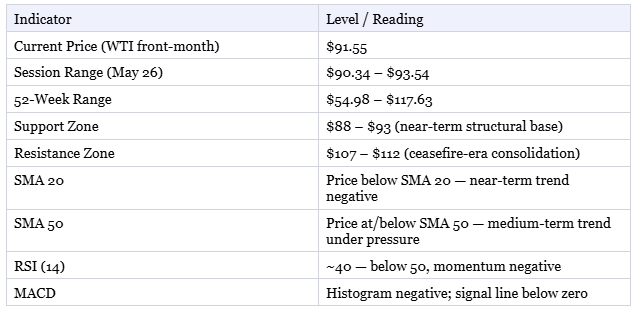

Figure 1. WTI Crude Oil (CLN26 — Jul ’26) — Daily Price, RSI(14), and MACD(12,26,9) | Jan–May 2026
WTI has traced a correction of about 22% from the $117.63 intraday high reached in late March to Tuesday’s $91.55 settlement, driven primarily by improving diplomatic sentiment rather than any structural shift in the physical supply picture. The RSI(14) has tracked below the 50 midpoint since the ceasefire period began in April, a persistent signal that downside momentum has been maintained even as daily volatility has increased around each headline cycle. The $88–$93 support band is structurally significant: it coincides with the pre-escalation trading range from early March and represents the level at which the market had not yet fully priced the physical disruption to Hormuz transit. A sustained close beneath $88 would suggest markets are discounting partial Hormuz reopening ahead of a formal agreement. Conversely, a reversal of Monday’s escalation narrative — driven by breakdown in the Qatar channel — would likely produce a rapid retest of the $107–$112 resistance zone, where the ceasefire-era price congestion is concentrated.
III. The Price Mechanism: Diplomacy Is Now the Dominant Variable
Prior to the 2026 crisis, the Strait of Hormuz carried about 20% of global petroleum liquids consumption and roughly one-quarter of seaborne oil trade, averaging approximately 20.9 million barrels per day in the first half of 2025, according to the U.S. Energy Information Administration. The physical closure that followed the February 28 strikes removed that supply from effective global availability and catalyzed the move from pre-war levels near $65 to the March highs above $117.
The price path since April 8 has increasingly been determined by the market’s probabilistic assessment of a deal timeline. WTI has fallen more than 10% over the past week, according to Barchart data, as U.S. officials signaled the final stages of negotiations. Monday’s mine-laying incident interrupted that narrative without invalidating it: Trump’s simultaneous declaration that talks were "productive" suggests the White House views the naval engagement as a discrete operational event rather than a diplomatic rupture.
The asymmetry matters here. A credible deal announcement would compress WTI toward the pre-crisis range — potentially to $70–$75 as initial reopening volumes flow — given the accumulated supply that has been rerouted or held in non-Gulf positions. A deal breakdown, by contrast, would not simply reverse recent losses; it would likely push prices back through $107–$112 toward the March highs, because the physical demining and transit restoration timeline under any realistic deal structure is measured in weeks, not days.
Rubio’s statement that the strait "will be open one way or another" captures this dynamic precisely. The phrase communicates U.S. resolve to force transit by military escort if diplomacy fails, but a unilateral escort operation without Iranian consent would constitute a materially higher-risk environment for tanker operators. The market’s preferred scenario — a negotiated framework — requires that Monday’s incident not be followed by Iranian retaliation within the ceasefire period.
The price is no longer tracking supply scarcity alone; it is tracking the probability that a deal materializes before the next escalation renders one impossible.
IV. Structural Context: Three Months of Price Dislocation
The 2026 Hormuz crisis has produced one of the most consequential disruptions to Gulf energy transit since the 1980s Tanker War, during which the U.S. Navy conducted Operation Earnest Will to escort Kuwaiti tankers through contested Persian Gulf waters. The structural comparison is imperfect — the current situation involves both parties actively restricting transit rather than unilateral interference — but the market-impact framework is instructive: the Tanker War produced persistent elevated volatility across multiple quarters before normalization.
The current crisis has proceeded through three distinct phases. The first, from February 28 through the April 8 ceasefire, was characterized by unambiguous supply removal and unidirectional price appreciation. The second, from April 8 through mid-May, saw prices retrace sharply as optimism over the Pakistan-mediated negotiating channel advanced, with WTI surrendering nearly $20 from peak levels. The third phase, which the market entered last week, is defined by simultaneous escalation and negotiation — a combination that produces the intraday reversal and cross-contract divergence seen Tuesday, with WTI down 5.2% while Brent gained 1.7%.
The Brent-WTI spread widening on Tuesday is analytically notable. Brent’s relative resilience may reflect stronger pricing for non-Gulf supply chains and international barrels, while WTI appears more sensitive to U.S.-deal repricing expectations. If Qatar talks stall, the spread may begin to compress as the deal-probability discount currently embedded in WTI is revised higher.
Gold’s behavior on Tuesday — down 0.2% to $4,559.43, according to market data — illustrates the second-order transmission channel. The metal had rallied through the early phases of the crisis as dollar softness and safe-haven demand converged. The recent correction from January 2026 highs above $5,589 partly reflects dollar stabilization near DXY 99, rising 10-year yields near 4.57%, and a reduction in the pure geopolitical risk premium as the ceasefire period extended. Monday’s incident introduces a partial reversal of that risk premium reduction, but the macro headwinds from elevated real yields remain the dominant framework for gold near-term.
V. Scenario Analysis
The following scenarios describe the principal pathways for WTI crude through the Qatar negotiating window, assuming no dramatic expansion of the conflict to third-party actors.
What to Watch
The 48 to 72 hours following Monday’s incident will be the critical observational window. If Iran responds with a retaliatory action against a commercial vessel, a U.S. allied asset, or via a formal diplomatic statement characterizing the IRGC vessel sinkings as a ceasefire violation, the Qatar framework will come under acute stress. The absence of Iranian retaliation, combined with continued positive framing from the Trump administration, would sustain the current base-case range and likely allow WTI to stabilize above $88.
The Brent-WTI divergence on Tuesday warrants close monitoring. The split reflects different market assessments of the deal’s timing rather than any change in the physical supply picture. A reconvergence of the two benchmarks — whether through Brent falling toward WTI or WTI recovering toward Brent — will signal which interpretation is prevailing. CENTCOM communications will be the most reliable near-real-time leading indicator; a shift from "defensive operations" language toward "escalatory" framing would constitute a meaningful revision to the deal-probability assessment markets are currently embedding.
The 10-year Treasury yield at 4.57% and the DXY near 99 represent macro parameters that will not wait for the Hormuz situation to resolve. If talks extend into June without a deal, energy-driven inflation expectations will begin to intersect with Federal Reserve policy uncertainty in ways that could pressure both equities and gold simultaneously. The current environment is one in which the oil market is providing the primary signal; every other asset class is in a secondary, reactive position.
Disclaimer: This article is published for informational purposes only and does not constitute investment advice or a solicitation to buy or sell any financial instrument. Price data is sourced from ICE, NYMEX/CME, The Wall Street Journal, Barchart.com, TradingEconomics.com, FRED (Federal Reserve Bank of St. Louis), and reporting on U.S. Central Command statements. The Strait of Hormuz transit volume figure is sourced from the U.S. Energy Information Administration chokepoints data (2025). Technical indicators are derived from publicly available price series and are presented for analytical context only. Past price behavior is not indicative of future results. Geopolitical scenarios described are illustrative and conditional; they are not forecasts. Readers should consult a qualified financial adviser before making investment decisions.